
| Symbol | Last | Change | % | High | Low |
|---|---|---|---|---|---|
| DOW FUTURES | 45,780.7 | -241.4 | -0.52% | 46,241.8 | 45,358.7 |
| Close | US Time : Sun Mar 22 2026 01:33 | ||||
Dow 30 Futures : Intraday Live Chart
Dow 30 Futures : Technical Signal Buy & Sell
| 5 Min Signal | 1 Hour Signal | 1 Day Signal |
|---|---|---|
| Buy | Sell | Sell |
Dow 30 Futures : Moving Averages
| Period | MA 20 | MA 50 | MA 100 |
|---|---|---|---|
| 5 Minutes | 45676.47 | 45665.65 | 45740.38 |
| 1 Hour | 45780.70 | 45831.24 | 46129.50 |
| 1 Day | 47165.33 | 48512.10 | 48641.42 |
| 1 Week | 48135.87 | 45490.08 | 43569.87 |
Dow 30 Futures : Technical Resistance Level
| Resistance 1 - R1 | Resistance 2 - R2 | Resistance 3 - r3 |
|---|---|---|
| 46,389.7 | 46,905.2 | 47,272.8 |
Dow 30 Futures : Technical Support Level
| Support 1 - S1 | Support 2 - S2 | Support 3 - S3 |
|---|---|---|
| 45,506.6 | 45,139.0 | 44,623.5 |
Dow 30 Futures : Periodical High, Low & Average
| Period | High Change from Last | Low Change from Last | Average Change from Last |
|---|---|---|---|
| 1 Week | 47,019.6 -1,238.9 | 45,358.7 +422.0 | 46,348.2 -567.5 |
| 1 Month | 49,628.9 -3,848.2 | 45,358.7 +422.0 | 47,658.6 -1,877.9 |
| 3 Month | 50,286.0 -4,505.3 | 45,358.7 +422.0 | 48,686.8 -2,906.1 |
| 6 Month | 50,286.0 -4,505.3 | 45,154.5 +626.2 | 47,886.0 -2,105.3 |
| 1 Year | 50,286.0 -4,505.3 | 36,515.0 +9,265.7 | 45,441.5 +339.2 |
Dow 30 Futures : Historical Chart
Group by:
Related News


About Dow Futures 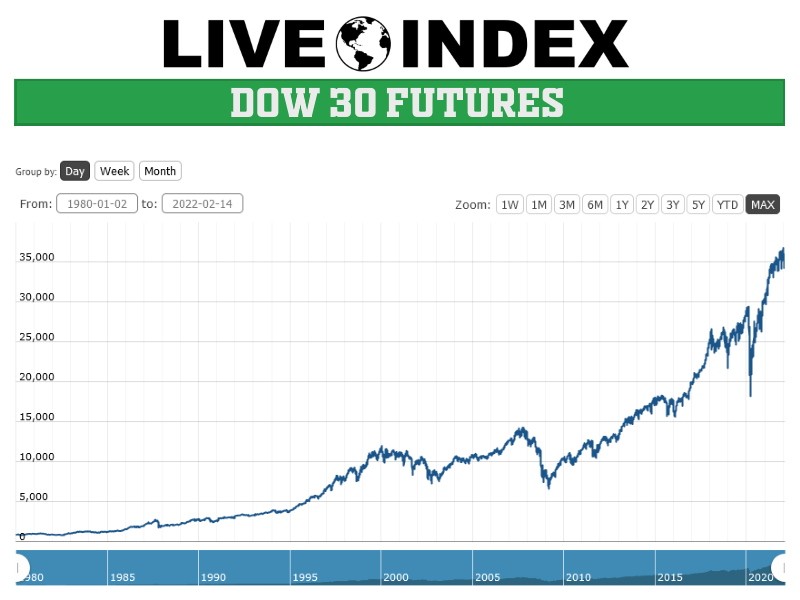
Dow Jones Futures - Dow Jones 30 Futures | Dow Jones Futures Live Quotes | US Futures
Live Price of Dow Jones Futures. Dow Jones Futures Live Chart, Intraday & Historical Chart. Dow Jones Futures Buy & Sell Signal and News & Videos, Dow Jones Futures Averages, Returns & Historical Data
» Dow Jones Futures
» Dow Jones Futures Real Time Quotes
» Dow Jones Futures Live Chart
» Dow Jones Futures Intraday Chart
» Dow Jones Futures Historical Chart
» Dow Jones Futures Buy Sell Signal
» Dow Jones Futures News
» Dow Jones Futures Videos
» Dow Jones Futures Averages
» Dow Jones Futures Returns
» Dow Jones Futures Historical Data