
| Symbol | Last | Change | % | High | Low |
|---|---|---|---|---|---|
| COLCAP – COLOMBIA | 0.0000 | +0.0000 | +0.00% | 0.0000 | 0.0000 |
| Time : Sun May 05 2024 11:22 | |||||
: Intraday Live Chart
: Technical Signal Buy & Sell
| 5 Min Signal | 1 Hour Signal | 1 Day Signal |
|---|---|---|
: Moving Averages
| Period | MA 20 | MA 50 | MA 100 |
|---|---|---|---|
| 5 Minutes | |||
| 1 Hour | |||
| 1 Day | |||
| 1 Week |
: Technical Resistance Level
| Resistance 1 - R1 | Resistance 2 - R2 | Resistance 3 - r3 |
|---|---|---|
| 1,227.7633 | 1,234.8400 | 1,245.6733 |
: Technical Support Level
| Support 1 - S1 | Support 2 - S2 | Support 3 - S3 |
|---|---|---|
| 1,209.8533 | 1,199.0200 | 1,191.9433 |
: Periodical High, Low & Average
| Period | High Change from Last | Low Change from Last | Average Change from Last |
|---|---|---|---|
| 1 Week | 0.0000 +0.0000 | 0.0000 +0.0000 | 0.0000 +0.0000 |
| 1 Month | 0.0000 +0.0000 | 0.0000 +0.0000 | 0.0000 +0.0000 |
| 3 Month | 0.0000 +0.0000 | 0.0000 +0.0000 | 0.0000 +0.0000 |
| 6 Month | 0.0000 +0.0000 | 0.0000 +0.0000 | 0.0000 +0.0000 |
| 1 Year | 0.0000 +0.0000 | 0.0000 +0.0000 | 0.0000 +0.0000 |
: Historical Chart
Group by:
Related News


About Colcap – Colombia 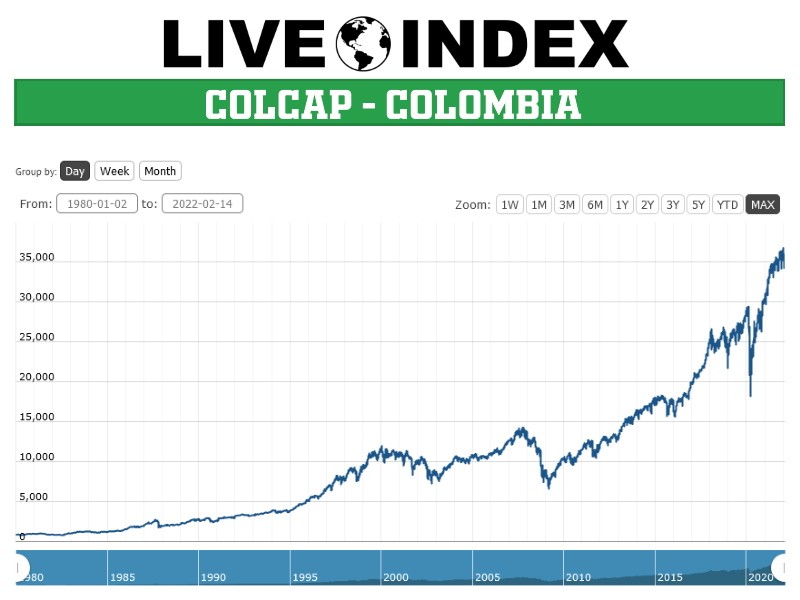
Colcap - Colcap Index | Colcap Live Quotes | Colombia Index
Live Price of Colcap. Colcap Live Chart, Colcap Intraday & Historical Live Chart. Colcap Buy Sell Signal, Colcap News, Colcap Videos, Colcap Averages, Returns & Historical Data
» Colcap
» Colcap Real Time Quotes
» Colcap Live Chart
» Colcap Intraday Chart
» Colcap Historical Chart
» Colcap Buy Sell Signal
» Colcap News
» Colcap Videos
» Colcap Averages
» Colcap Returns
» Colcap Historical Data