
| Symbol | Last | Change | % | High | Low |
|---|---|---|---|---|---|
| CLX IPSA – CHILE | 6,559.05 | +60.84 | +0.94% | 6,570.92 | 6,497.82 |
| Close | Chile Time : Sun May 05 2024 09:52 | ||||
CLX IPSA : Intraday Live Chart
CLX IPSA : Technical Signal Buy & Sell
| 5 Min Signal | 1 Hour Signal | 1 Day Signal |
|---|---|---|
| Sell | Sell |
CLX IPSA : Moving Averages
| Period | MA 20 | MA 50 | MA 100 |
|---|---|---|---|
| 5 Minutes | |||
| 1 Hour | 6505.17 | 6508.85 | 6502.59 |
| 1 Day | 6445.24 | 6513.34 | 6363.11 |
| 1 Week | 6276.32 | 5977.47 | 5604.66 |
CLX IPSA : Technical Resistance Level
| Resistance 1 - R1 | Resistance 2 - R2 | Resistance 3 - r3 |
|---|---|---|
| 6,546.55 | 6,570.92 | 6,619.65 |
CLX IPSA : Technical Support Level
| Support 1 - S1 | Support 2 - S2 | Support 3 - S3 |
|---|---|---|
| 6,473.45 | 6,424.72 | 6,400.35 |
CLX IPSA : Periodical High, Low & Average
| Period | High Change from Last | Low Change from Last | Average Change from Last |
|---|---|---|---|
| 1 Week | 6,570.92 -11.87 | 6,311.56 +247.49 | 6,511.90 +47.15 |
| 1 Month | 6,730.75 -171.70 | 6,310.07 +248.98 | 6,490.06 +68.99 |
| 3 Month | 6,730.75 -171.70 | 5,956.07 +602.98 | 6,405.04 +154.01 |
| 6 Month | 6,730.75 -171.70 | 5,448.88 +1,110.17 | 6,173.10 +385.95 |
| 1 Year | 6,730.75 -171.70 | 3,142.62 +3,416.43 | 5,989.36 +569.69 |
CLX IPSA : Historical Chart
Group by:
Related News


About CLX IPSA – Chile 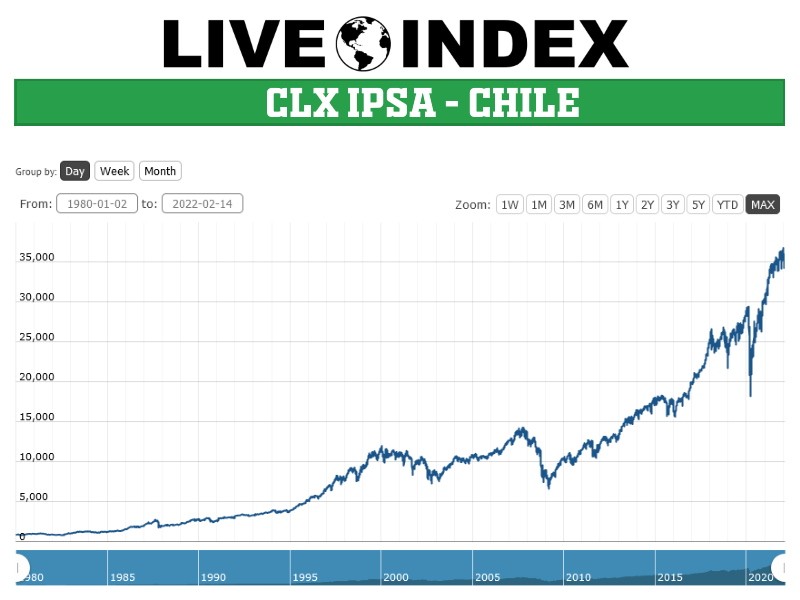
CLX IPSA - CLX IPSA Index | CLX IPSA Live Quotes | Chile Index
Live Price of CLX IPSA. CLX IPSA Live Chart, CLX IPSA Intraday & Historical Live Chart. CLX IPSA Buy Sell Signal, CLX IPSA News, CLX IPSA Videos, CLX IPSA Averages, Returns & Historical Data
» CLX IPSA
» CLX IPSA Real Time Quotes
» CLX IPSA Live Chart
» CLX IPSA Intraday Chart
» CLX IPSA Historical Chart
» CLX IPSA Buy Sell Signal
» CLX IPSA News
» CLX IPSA Videos
» CLX IPSA Averages
» CLX IPSA Returns
» CLX IPSA Historical Data