
| Symbol | Last | Change | % | High | Low |
|---|---|---|---|---|---|
| BEL – BELGIUM | 5,420.99 | -34.60 | -0.63% | 5,426.77 | 5,402.49 |
| Open Last Trade : 11:30 | Belgium Time : Mon Apr 13 2026 11:30 | ||||
BEL 20 : Intraday Live Chart
BEL 20 : Technical Signal Buy & Sell
| 5 Min Signal | 1 Hour Signal | 1 Day Signal |
|---|---|---|
| Buy | Sell | Sell |
BEL 20 : Moving Averages
| Period | MA 20 | MA 50 | MA 100 |
|---|---|---|---|
| 5 Minutes | 5417.85 | 5416.99 | 5416.99 |
| 1 Hour | 5454.51 | 5454.77 | 5440.42 |
| 1 Day | 5175.70 | 5276.34 | 5311.67 |
| 1 Week | 5226.08 | 4897.85 | 4502.58 |
BEL 20 : Technical Resistance Level
| Resistance 1 - R1 | Resistance 2 - R2 | Resistance 3 - r3 |
|---|---|---|
| 5,461.99 | 5,483.09 | 5,522.17 |
BEL 20 : Technical Support Level
| Support 1 - S1 | Support 2 - S2 | Support 3 - S3 |
|---|---|---|
| 5,401.81 | 5,362.73 | 5,341.63 |
BEL 20 : Periodical High, Low & Average
| Period | High Change from Last | Low Change from Last | Average Change from Last |
|---|---|---|---|
| 1 Week | 5,479.97 -58.98 | 5,144.21 +276.78 | 5,371.48 +49.51 |
| 1 Month | 5,479.97 -58.98 | 4,774.82 +646.17 | 5,148.83 +272.16 |
| 3 Month | 5,691.52 -270.53 | 4,774.82 +646.17 | 5,339.36 +81.63 |
| 6 Month | 5,691.52 -270.53 | 4,774.82 +646.17 | 5,176.42 +244.57 |
| 1 Year | 5,691.52 -270.53 | 3,961.24 +1,459.75 | 4,875.20 +545.79 |
BEL 20 : Historical Chart
Group by:
Related News


About BEL – Belgium 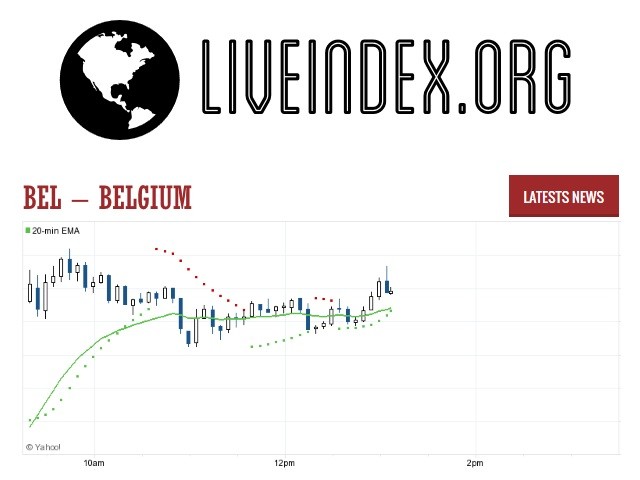
BEL - BEL 20 Index | BEL 20 Live Quotes | Austria Index
Live Price of BEL. BEL Live Chart, BEL Intraday & Historical Live Chart. BEL Buy Sell Signal, BEL News, BEL Videos, BEL Averages, Returns & Historical Data
» BEL
» BEL Real Time Quotes
» BEL Live Chart
» BEL Intraday Chart
» BEL Historical Chart
» BEL Buy Sell Signal
» BEL News
» BEL Videos
» BEL Averages
» BEL Returns
» BEL Historical Data