
| Symbol | Last | Change | % | High | Low |
|---|---|---|---|---|---|
| ATHEX – GREECE | 2,225.74 | -60.18 | -2.63% | 2,272.45 | 2,225.22 |
| Close | Greece Time : Mon Apr 13 2026 12:30 | ||||
Athex : Intraday Live Chart
Athex : Technical Signal Buy & Sell
| 5 Min Signal | 1 Hour Signal | 1 Day Signal |
|---|---|---|
| Buy | Sell |
Athex : Moving Averages
| Period | MA 20 | MA 50 | MA 100 |
|---|---|---|---|
| 5 Minutes | |||
| 1 Hour | 2228.45 | 2226.85 | 2234.05 |
| 1 Day | 2117.99 | 2165.51 | 2210.50 |
| 1 Week | 2179.47 | 2045.64 | 1768.16 |
Athex : Technical Resistance Level
| Resistance 1 - R1 | Resistance 2 - R2 | Resistance 3 - r3 |
|---|---|---|
| 2,288.19 | 2,319.68 | 2,335.42 |
Athex : Technical Support Level
| Support 1 - S1 | Support 2 - S2 | Support 3 - S3 |
|---|---|---|
| 2,240.96 | 2,225.22 | 2,193.73 |
Athex : Periodical High, Low & Average
| Period | High Change from Last | Low Change from Last | Average Change from Last |
|---|---|---|---|
| 1 Week | 2,285.92 -60.18 | 2,089.13 +136.61 | 2,207.41 +18.33 |
| 1 Month | 2,285.92 -60.18 | 1,998.09 +227.65 | 2,114.45 +111.29 |
| 3 Month | 2,407.09 -181.35 | 1,998.09 +227.65 | 2,219.56 +6.18 |
| 6 Month | 2,407.09 -181.35 | 1,948.59 +277.15 | 2,145.58 +80.16 |
| 1 Year | 2,407.09 -181.35 | 1,557.53 +668.21 | 2,030.97 +194.77 |
Athex : Historical Chart
Group by:
Related News


About Athex – Greece 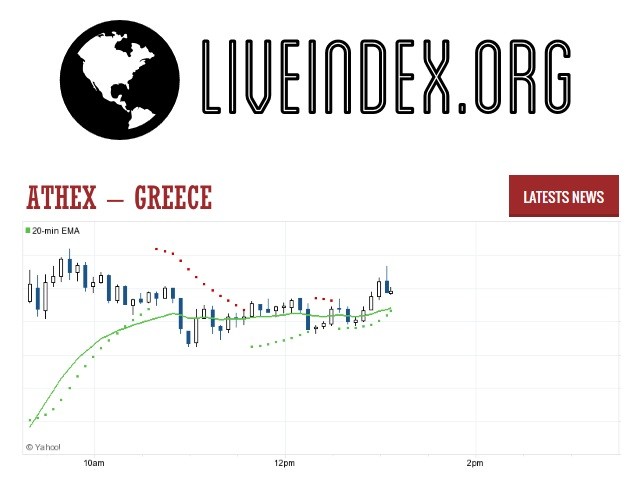
The FTSE/Athex Large Cap is the index of the twenty-five largest companies on the Athens Stock Exchange. It was renamed from FTSE/Athex 20 and extended from 20 to 25 companies on December 3, 2012.
Athex - Athex 25 Index | Athex 25 Live Quotes | Greece Index
Live Price of Athex. Athex Live Chart, Athex Intraday & Historical Live Chart. Athex Buy Sell Signal, Athex News, Athex Videos, Athex Averages, Returns & Historical Data
» Athex
» Athex Real Time Quotes
» Athex Live Chart
» Athex Intraday Chart
» Athex Historical Chart
» Athex Buy Sell Signal
» Athex News
» Athex Videos
» Athex Averages
» Athex Returns
» Athex Historical Data