
| Symbol | Last | Change | % | High | Low |
|---|---|---|---|---|---|
| IBVC BURSATIL – VENEZUELA | 6,591.66 | -7.90 | -0.12% | 6,624.97 | 6,591.66 |
| Close | Venezuela Time : Sat Mar 14 2026 10:27 | ||||
IBVC Bursatil : Intraday Live Chart
IBVC Bursatil : Technical Signal Buy & Sell
| 5 Min Signal | 1 Hour Signal | 1 Day Signal |
|---|---|---|
| Neutral | Sell | Buy |
IBVC Bursatil : Moving Averages
| Period | MA 20 | MA 50 | MA 100 |
|---|---|---|---|
| 5 Minutes | 6591.66 | 6591.66 | 6591.66 |
| 1 Hour | 6591.66 | 6599.83 | 6610.72 |
| 1 Day | 6484.47 | 5385.65 | 4053.27 |
| 1 Week | 3412.91 | 111282.44 | 107838.86 |
IBVC Bursatil : Technical Resistance Level
| Resistance 1 - R1 | Resistance 2 - R2 | Resistance 3 - r3 |
|---|---|---|
| 6,596.93 | 6,599.56 | 6,604.83 |
IBVC Bursatil : Technical Support Level
| Support 1 - S1 | Support 2 - S2 | Support 3 - S3 |
|---|---|---|
| 6,589.03 | 6,583.76 | 6,581.13 |
IBVC Bursatil : Periodical High, Low & Average
| Period | High Change from Last | Low Change from Last | Average Change from Last |
|---|---|---|---|
| 1 Week | 6,920.79 -329.13 | 6,480.74 +110.92 | 6,623.66 -32.00 |
| 1 Month | 7,111.14 -519.48 | 5,319.37 +1,272.29 | 6,228.46 +363.20 |
| 3 Month | 7,111.14 -519.48 | 1,450.57 +5,141.09 | 4,363.13 +2,228.53 |
| 6 Month | 7,111.14 -519.48 | 960.63 +5,631.03 | 2,869.69 +3,721.97 |
| 1 Year | 534,358.00 -527,766.34 | 523.60 +6,068.06 | 113,364.94 -106,773.28 |
IBVC Bursatil : Historical Chart
Group by:
Related News


About IBVC Bursatil – Venezuela 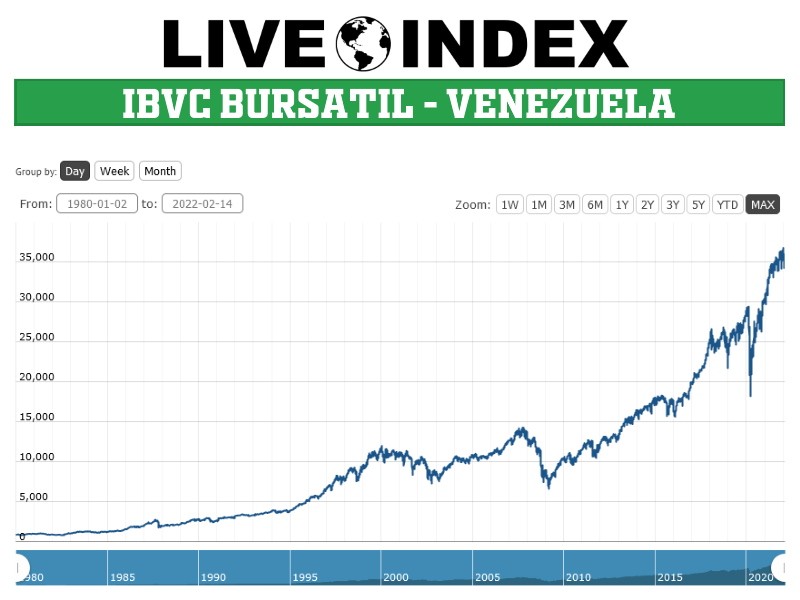
IBVC Bursatil - IBVC Bursatil Index | IBVC Bursatil Live Quotes | Venezuela Index
Live Price of IBVC Bursatil. IBVC Bursatil Live Chart, IBVC Bursatil Intraday & Historical Live Chart. IBVC Bursatil Buy Sell Signal, IBVC Bursatil News, IBVC Bursatil Videos, IBVC Bursatil Averages, Returns & Historical Data
» IBVC Bursatil
» IBVC Bursatil Real Time Quotes
» IBVC Bursatil Live Chart
» IBVC Bursatil Intraday Chart
» IBVC Bursatil Historical Chart
» IBVC Bursatil Buy Sell Signal
» IBVC Bursatil News
» IBVC Bursatil Videos
» IBVC Bursatil Averages
» IBVC Bursatil Returns
» IBVC Bursatil Historical Data