
| Symbol | Last | Change | % | High | Low |
|---|---|---|---|---|---|
| CLX IPSA – CHILE | 11,076.7 | +118.3 | +1.08% | 11,126.4 | 10,958.3 |
| Close | Chile Time : Mon Apr 13 2026 02:15 | ||||
CLX IPSA : Intraday Live Chart
CLX IPSA : Technical Signal Buy & Sell
| 5 Min Signal | 1 Hour Signal | 1 Day Signal |
|---|---|---|
| Sell | Buy |
CLX IPSA : Moving Averages
| Period | MA 20 | MA 50 | MA 100 |
|---|---|---|---|
| 5 Minutes | |||
| 1 Hour | 11069.55 | 11073.73 | 11009.93 |
| 1 Day | 10648.74 | 10646.62 | 10868.42 |
| 1 Week | 10679.03 | 9461.59 | 8131.86 |
CLX IPSA : Technical Resistance Level
| Resistance 1 - R1 | Resistance 2 - R2 | Resistance 3 - r3 |
|---|---|---|
| 11,070.4 | 11,126.4 | 11,238.5 |
CLX IPSA : Technical Support Level
| Support 1 - S1 | Support 2 - S2 | Support 3 - S3 |
|---|---|---|
| 10,902.3 | 10,790.2 | 10,734.2 |
CLX IPSA : Periodical High, Low & Average
| Period | High Change from Last | Low Change from Last | Average Change from Last |
|---|---|---|---|
| 1 Week | 11,126.4 -49.7 | 10,508.5 +568.2 | 10,894.3 +182.4 |
| 1 Month | 11,126.4 -49.7 | 10,122.7 +954.0 | 10,605.1 +471.6 |
| 3 Month | 11,721.4 -644.7 | 9,931.3 +1,145.4 | 10,902.4 +174.3 |
| 6 Month | 11,721.4 -644.7 | 8,675.8 +2,400.9 | 10,404.9 +671.8 |
| 1 Year | 11,721.4 -644.7 | 4,183.8 +6,892.9 | 9,376.6 +1,700.1 |
CLX IPSA : Historical Chart
Group by:
Related News


About CLX IPSA – Chile 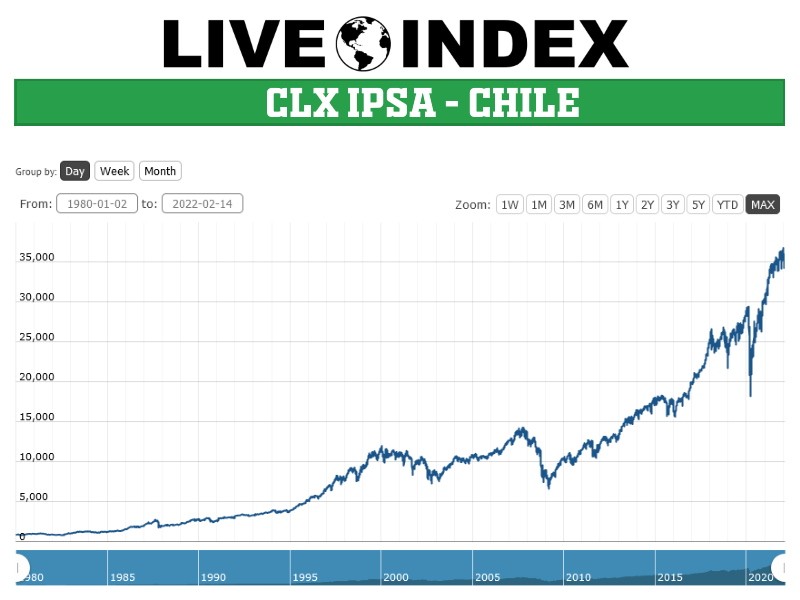
CLX IPSA - CLX IPSA Index | CLX IPSA Live Quotes | Chile Index
Live Price of CLX IPSA. CLX IPSA Live Chart, CLX IPSA Intraday & Historical Live Chart. CLX IPSA Buy Sell Signal, CLX IPSA News, CLX IPSA Videos, CLX IPSA Averages, Returns & Historical Data
» CLX IPSA
» CLX IPSA Real Time Quotes
» CLX IPSA Live Chart
» CLX IPSA Intraday Chart
» CLX IPSA Historical Chart
» CLX IPSA Buy Sell Signal
» CLX IPSA News
» CLX IPSA Videos
» CLX IPSA Averages
» CLX IPSA Returns
» CLX IPSA Historical Data