| Symbol | Last | Change | % | High | Low |
|---|---|---|---|---|---|
| AEX – NETHERLANDS | 997.23 | -11.73 | -1.16% | 1,009.32 | 996.64 |
| Open Last Trade : 13:36 | Netherlands Time : Thu Feb 12 2026 13:36 | ||||
AEX : Intraday Live Chart
AEX : Technical Signal Buy & Sell
| 5 Min Signal | 1 Hour Signal | 1 Day Signal |
|---|---|---|
| Sell | Buy | Buy |
AEX : Moving Averages
| Period | MA 20 | MA 50 | MA 100 |
|---|---|---|---|
| 5 Minutes | 997.78 | 999.84 | 1000.71 |
| 1 Hour | 1006.35 | 1005.33 | 1000.20 |
| 1 Day | 998.91 | 984.73 | 965.57 |
| 1 Week | 964.68 | 911.75 | 906.15 |
AEX : Technical Resistance Level
| Resistance 1 - R1 | Resistance 2 - R2 | Resistance 3 - r3 |
|---|---|---|
| 1,012.90 | 1,017.80 | 1,023.57 |
AEX : Technical Support Level
| Support 1 - S1 | Support 2 - S2 | Support 3 - S3 |
|---|---|---|
| 1,002.23 | 996.46 | 991.56 |
AEX : Periodical High, Low & Average
| Period | High Change from Last | Low Change from Last | Average Change from Last |
|---|---|---|---|
| 1 Week | 1,013.78 -16.55 | 979.33 +17.90 | 997.62 -0.39 |
| 1 Month | 1,017.39 -20.16 | 979.33 +17.90 | 999.49 -2.26 |
| 3 Month | 1,017.39 -20.16 | 916.79 +80.44 | 965.94 +31.29 |
| 6 Month | 1,017.39 -20.16 | 883.89 +113.34 | 950.37 +46.86 |
| 1 Year | 1,017.39 -20.16 | 784.66 +212.57 | 923.10 +74.13 |
AEX : Historical Chart
The AEX index, derived from Amsterdam Exchange index, is a stock market index composed of Dutch companies that trade on Euronext Amsterdam, formerly known as the Amsterdam Stock Exchange. Started in 1983, the index is composed of a maximum of 25 of the most actively traded securities on the exchange.
The AEX started from a base level of 100 index points on 3 January 1983 (a corresponding value of 45.378 is used for historic comparisons due to the adoption of the Euro). The index’s peak to date is 703.18, reached on 5 September 2000 at the height of the dot-com bubble. The index value more than halved over the following three years before recovering in line with most global financial markets.
The AEX index enjoyed its second largest one-day loss on September 29, 2008, when the index closed down almost 9%. The decade between 1998 and 2008 has been bad for the AEX index, as it has been the worst performing stock index except for the OMX Iceland 15. The preceding years were a lot better compared to the rest of the world.
AEX - AEX 25 Index | AEX 25 Live Quotes | Netherlands Index
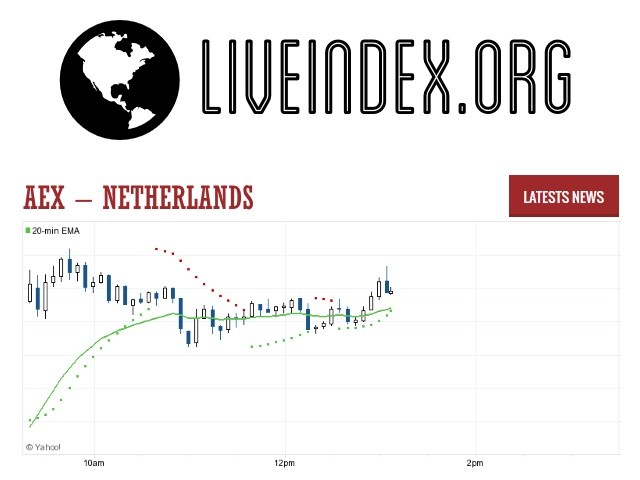
Live Price of AEX. AEX Live Chart, AEX Intraday & Historical Live Chart. AEX Buy Sell Signal, AEX News, AEX Videos, AEX Averages, Returns & Historical Data
» AEX
» AEX Real Time Quotes
» AEX Live Chart
» AEX Intraday Chart
» AEX Historical Chart
» AEX Buy Sell Signal
» AEX News
» AEX Videos
» AEX Averages
» AEX Returns
» AEX Historical Data

