
Is S&P 500 nearing a breakout on the upside?
“Lower interest rates have created momentum conditions where higher prices continue to bring in buyers. This momentum dynamic has pushed this bull market much further than anyone could have expected and the current trend remains up but is showing signs that a correction may be approaching.”
All of the U.S. major indexes made all time highs on August 11, 2016. Yet, on the next day the economic data showed an economy that is much weaker than many realize as producer prices and consumer confidence sank while the world’s largest shipper, Maersk, reported a nearly 90% decrease in its year-over-year profit. Something has to give, and when investors decide that economic fundamentals do count we could see a significant decline in stocks. That said, we may not be anywhere near that point yet.
Low Volatility Suggests Big Move is still on its Way
I’ve been writing about low volatility for several weeks, and how it is a prelude to a big move. This week I am featuring the Bollinger Band indicator (BB) and its relationship to the S&P 500 (SPX). This indicator can be useful in marking periods when the market has gone too far to the upside or downside, or when it’s about to make a significant move. In its current positioning, it is suggesting that a big move is coming. It is not a good predictor of the direction of the move, but other indicators – as I will show just below – can often be helpful in figuring the direction of any breakout.
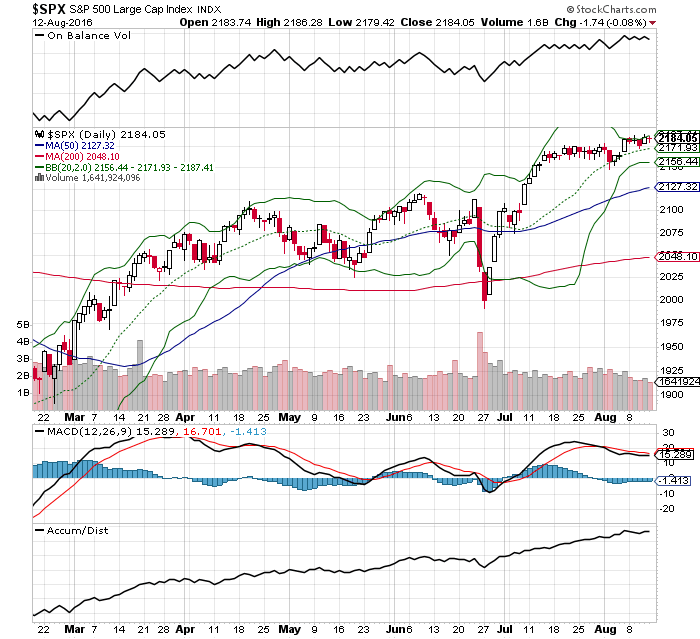
Bollinger bands are essentially dynamic price channels that are traditionally configured two standard deviations above or below a moving average. They are built on the premise that prices can’t deviate from the mean (moving average) forever and that when prices move too far in one direction – up or down – they will reverse direction. You can use any moving average such as the 10, 20, 50 or 100-day trend lines along with the bands. For this example I will use the 20-day moving average (green dotted line) since it is the most commonly used moving average when looking at the intermediate term (weeks to months) trading activity of the market.
Bollinger Band Analysis
First, let’s look at the Bollinger Bands, the green lines above the S & P 500 over the past few months and see how they have worked. Note the following in the chart:
- The market’s rally reversed in April when prices spiked above the upper band. This is an example of how the bands signal that the market has gone too far to the upside.
- The market’s May and July declines reversed when prices fell outside the lower band. This is an example of how the bands signal that the market has fallen more than normal price behavior can tolerate.
- The Bollinger Bands tightened in April, May, and July before the market broke out of a trading range.
- The Bollinger Bands are currently much tighter (closer together) than before any of the three previous moves where the market broke out of a trading range. This suggests that the next move will be very significant.
Beyond the Bands
Next, let’s look at the other important indicators on this chart:
- The market is clearly in an uptrend as it is trading above its 20-day (green dotted line), 50-day (blue line) and 200-day (red line) moving averages.
- On balance volume (upper panel) shows more money is moving into rising stocks in the S&P 500
- The MACD and MACD histogram (lower panel) indicators are moving sideways, confirming that momentum is trending sideways. This is what you would expect in a consolidation trading pattern.
- The Accumulation Distribution line confirms the on balance volume indicator.
Conclusion
If the Bollinger Bands and the other indicators are correct, I would expect the next move in the S&P 500 to be to the upside, and I would expect it to be very significant. As a trader I would look to the price behavior of this index to warn of a reversal when prices rise above the upper Bollinger Band. There are no guarantees when trading or investing. But money has clearly moved into this market and when enough money moves in the buyers eventually overwhelm the sellers. We could be near one of those points.


