Why the Market’s Next Move is So Important

The U.S. stock market closed modestly higher last week, notching its fourth consecutive weekly gain. It was led by the defensive Dow Jones Industrial Average, which advanced 1.2%. The market was held in check by major overhead resistance levels in the Dow and S&P 500, which I will discuss in detail in a moment.
All sectors of the S&P 500 finished in positive territory last week, led by energy. As I pointed out in the previous report, Asbury Research’s metric showed energy has had the biggest sector-related inflow of investor assets over the past month, which fueled its gains.
Since its Jan. 20 low, the Energy Select Sector SPDR ETF (NYSE: XLE) is up 24.9%, outperforming the S&P 500 by 13.3 points. As long as investor assets continue to flow into energy, the recent strength is likely to continue.
Market Tests Major Resistance but Leaning Higher
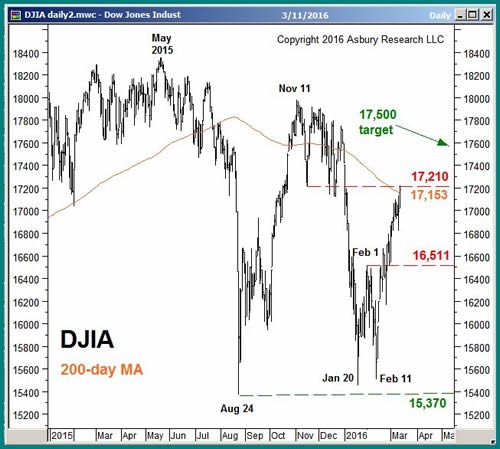
In the Feb. 29 Market Outlook, I identified a bullish chart pattern in the Dow that targeted a move to 17,500. The index has since risen 3.5% into Friday’s 17,213 close, putting it just above formidable overhead resistance at 17,153 to 17,210. This resistance corresponds to significant resistance near 2,020 in the S&P 500, which I covered in last week’s report.

A sustained rise above 17,210 would clear the way for an advance to our 17,500 target and would likely be accompanied by a coincident rise above 2,020 in the S&P 500. If the Volatility S&P 500 (VIX) remains below its 50-day moving average, now at 21.87, it will indicate investors are complacent enough to support higher stock prices.
Bigger Picture Still Looks Threatening
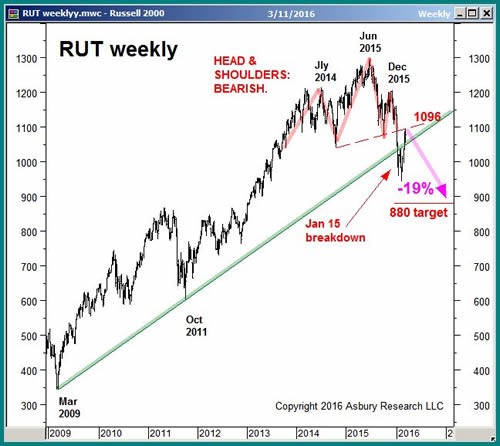
In the Feb. 22 Market Outlook, I alerted readers to the bearish head-and-shoulders chart pattern in the small-cap Russell 2000 that targeted a decline to 880. That is 19% below Friday’s close and will remain valid as long as the 1,096 area loosely holds as overhead resistance.

Even though conditions appear favorable for more near-term strength, this chart pattern — as well as similar ones I have identified in several positively correlated overseas markets — warn that the market is vulnerable to an even deeper decline in the months ahead.
Editor’s note: Some investors are preparing for leaner economic times by skimming money from Wall Street now. You see, Wall Street makes billions by collecting money from stock orders that they never fill. But there’s a legal way you can steal some of this money from them, pocketing hundreds over and over again. Find out how by watching this free presentation.
Oil Prices Remain a Big Influence on Stocks
Speaking of financial assets that are positively correlated to the U.S. stock market, one worth paying special attention to is crude oil.
I first pointed out this correlation in the Feb. 16 Market Outlook. At the time, I identified underlying support at $ 30.81 to $ 28.10 per barrel in West Texas Intermediate (WTI) crude oil, which was being tested. I said that as long as this support held, I would view it as an indirect indication that 1,821 support on the S&P 500 would also continue to hold.
Since then, WTI has gained more than 30% into Friday’s $ 38.50 close, testing an important overhead resistance at $ 38.25 per barrel. As we would expect, the S&P 500 has risen by 8.4% during that time.

How crude oil prices react to $ 38.25 resistance over the next week or so will be a key indication of upcoming stock market direction.
Interest Rates Also at Inflection Point
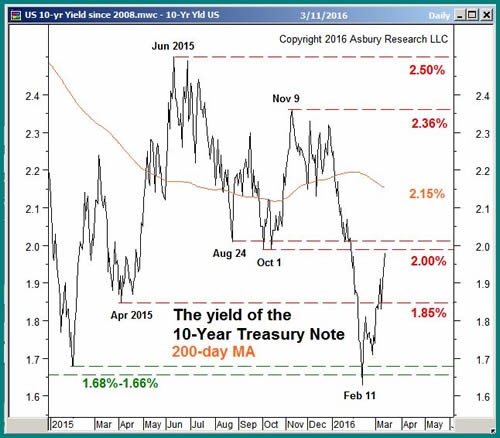
In the Feb. 8 Market Outlook, with the yield of the benchmark 10-year Treasury note at 1.86%, I said the next key downside level was 1.68%. Yields tested that level four days later, held it and are now testing important overhead resistance at 2%, closing Friday at 1.98%.

The 2% level is another important inflection point for long-term U.S. interest rates. From there, either a move to 2.15% or a decline back to 1.85% is likely.
These yields are also positively correlated to the S&P 500, though to a lesser degree than crude oil. Therefore, I will view the 10-year note’s upcoming reaction to 2% as another indirect indication of upcoming U.S. stock market direction.
Putting It All Together
Two key indices begin this week at important overhead resistance levels — 17,210 in the Dow industrials and 2,020 in the S&P 500 — from which their next near-term directional move is likely to begin.
Currently, low market volatility favors more near-term strength, including a rise in the Dow to my 17,500 target. More intermediate term, however, the market-leading Russell 2000 warns of a deeper decline in the broader market — one that would be corroborated by declining oil prices and/or declining long-term interest rates.


