
Where Does The Market Go From Here…
Yesterday’s market tumble finally brought the S&P and Nasdaq alongside the Dow Jones into correction territory, sending the broader index down 11% from its highs, even as a vast majority of S&P constituents already preceded the index and are either in correction or in bear market territory. And yet, following today’s latest central bank intervention, this time in the long overdue Chinese interest rate cut (which will hardly have a lasting impact on either the economy or stock markets), the S&P correction may prove to be short lived: S&P is poised to open about 3-4% higher, delivering the latest “Bullard” moment to the S&P, this time courtesy of China.
Still, the question remains: was that it for the long overdue correction, and what comes next.
One suggestion comes from Goldman, which looks at the today’s market and the raging EM crisis, and compares the S&P to the last Asian crisis in 1998, which it hopes will serve as the anchor correlation pair until the end of the year.
This is what Goldman’s David Kostin says:
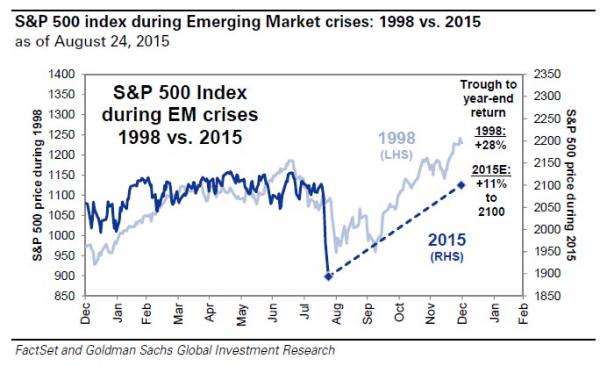
S&P 500 has corrected for the first time in three years, declining by 11% from its May record high. Concern about China economic growth was the immediate catalyst for the correction. We expect the US economy will avoid contagion and continue to expand. S&P 500 will rise by 11% to reach 2100 at year-end. Such a rebound would echo the trading pattern exhibited in 1998 when US equities rallied and largely ignored the Asian financial crisis.
Some more details from Goldman:
The S&P 500 retreated by 10% during the past seven days and has dropped by 11% since reaching an all-time high in May. Weakness across emerging markets is the leading culprit. Last week China’s flash PMI registered its lowest reading during the last six years leading investors to expect that the PBoC would cut interest rates. When this failed to materialize, the Shanghai Composite index fell by 9% on Monday. The Shanghai index has plummeted by 38% since June.
We believe the US economy will avoid recession in 2016. However, investors are concerned that the drop in commodity prices during the past year, the nearly 40% collapse in China equity prices during the past two months, and economic and FX weakness across many emerging markets will serve as a drag on US growth. The risk of potential contagion from a slowdown in China has prompted an 11% correction in the S&P 500 index for the first time since 2012.
A similar correction occurred in 1998 before the market rebounded. S&P 500 plunged by 14% during August 1998 before rallying by 29% during the last four months of the year. Admittedly, it was a different time and place in that emerging markets contributed a smaller share of global GDP than today, the US was in the midst of what was later to become the Tech bubble, and the Fed cut interest rates 3 times in response to financial markets that were reeling from Russia’s default on its sovereign debt and the collapse of the Long-term Capital Management (LTCM) hedge fund.
Ultimately, the US economy was relatively unaffected by overseas financial market gyrations in 1998 and we believe a similar situation will occur in 2015. Our analysis of the geographic revenue exposure of S&P 500 constituents reveals that the US accounts for 67% of aggregate sales. Approximately 8% of revenues stemmed from the Asia-Pacific region with 1% disclosed as coming specifically from Japan and 2% from China. From an economics perspective, US exports account for roughly 13% of total US GDP, which includes 5% to emerging markets and less than 1% to China.
Goldman’s optimism is, as usual, contagious. There are however a few problems with it. As Kostin himself admits, “between July and August 1998, the S&P 500 fell by 19% amid fears of financial meltdown in Asia and Russia. The rout in the US market ended when the Fed intervened with three interest rate cuts.”
The problem is that not only is the Fed not going to cut rates three times, or even once, but is about to hike.
The other problem is that when it comes to predicting the future, lately Goldman has been, in a word, lousy: recall from July 8, when the Chinese stock market started its dead cat bounce only to crash in the past month and a half. From Bloomberg on July 7:
Goldman Sachs Says There’s No China Stock Bubble, Sees Rally
Kinger Lau, the bank’s China strategist in Hong Kong, predicts the large-cap CSI 300 Index will rally 27 percent from Tuesday’s close over the next 12 months as government support measures boost investor confidence and monetary easing spurs economic growth. Leveraged positions aren’t big enough to trigger a market collapse, Lau says, and valuations have room to climb.
Goldman Sachs is sticking with its optimistic forecast in the face of record foreign outflows, the biggest-ever selloff by Chinese margin traders and a chorus of bubble warnings from international peers. The call hinges on the success of unprecedented government efforts to revive confidence among individual investors who watched equity values tumble by $ 3.2 trillion over the past three weeks.
“It’s not in a bubble yet,” Lau said in an interview. “China’s government has a lot of tools to support the market.”
With the SHCOMP crashing and the market rising, then collapsing since Goldman’s “assessment” it appears the Chinese government was all but out of tools, and Goldman may have been a little too aggressive with its Chinese optimism (unless of course it was merely looking for muppets to dump its Chinese exposure to).
So if we ignore Goldman and its latent optimistic bias (especially since Goldman is well-known to do the opposite of what it recommends, in which case we agree with it wholeheartedly), here is a less euphoric, and more tempered perspective on what may happen next, courtesy of Doug Kass:
Here’s my view of the possible scenarios ahead, which form the basis of my fair-market-value calculation:
- Scenario #1: Economic Acceleration Above Consensus (probability: 10%).Characteristics: 3% real U.S. GDP growth, 2% to 3% inflation and 8% to 12% profit growth. Outcome: Stocks climb 7.5% over the next 12 to 18 months and my S&P 500 target is 2245.
- Scenario #2: Status Quo (probability: 25%). Characteristics: 2% to +3% real U.S. GDP growth, 1.5% to 2% inflation and 5% to 9% profit growth. Outcome: Stocks climb 5% over the next 12 to 18 months and my S&P 500 target is 2195.
- Scenario #3: Muddle Along (probability: 25%). Characteristics: 2% real U.S. GDP growth, 1.5% inflation and 3% to 5% profit growth. Outcome: Stocks gain 0% to 5% over the next 12 to 18 months and my S&P 500 target is 2140.
- Scenario #4: A Garden Variety Recession (probability: 25%). Characteristics: Negative real U.S. GDP growth, less than 0.5% inflation and a decline in profits. Outcome: Stocks drop 13% to 17% over the next 12 to 18 months and my S&P 500 target is 1775.
- Scenario #5: A Deep Recession (probability: 15%). Characteristics: Negative real US GDP growth, deflation and a large drop in profits. Outcome: Stocks drop by more than 20% over the next 12 to 18 months and my S&P 500 target is 1625.
When I combine the above scenarios’ probabilities against my S&P targets for each, I come to an S&P 500 fair-market value of about 1990 (vs. the roughly 1945 the futures are showing right now).
So one expectation fo 2100, another of 1990, and yet the final word belongs to Janet Yellen: should she proceed with a rate hike as the Fed has long hinted, both of the above recommendations will likely be scrapped and what happens will be something totally different and unexpected. And the biggest irony is that as US stocks are set to soar, the probability of a Fed rate hike gets that much more likely, thus undoing the very reason why stocks were soaring in the first place.


