Chart Anomaly Signals This Stock is in for a Snapback Rally
One of my favorite investing tactics is to target stocks that are fundamentally solid but get hit hard when investors overact to news stories.
Russia’s ban on U.S. chicken and oversupply concerns helped knock the United States’ third-largest poultry processor 25% off its summer highs.
I recommended a bullish options play on Sanderson Farms (NASDAQ: SAFM) in late June that quickly netted us 42% profits as the stock hit a 52-week high in mid-July.
Shortly after, Vladimir Putin imposed a one-year embargo on U.S. agricultural products, including chicken, in response to Western economic sanctions stemming from the Ukrainian conflict.
The news sent shockwaves through the American poultry industry. But its effects are being felt to a much greater extent in Russia, where I hear they are turning to crocodile meat to get their protein.
While Russia accounted for nearly 40% of U.S. chicken exports in the 1990s, that number has dropped to just 7% recently, according to the National Chicken Council.
With a number of bullish tailwinds, I think the sell-off in SAFM represents a chance to pocket another big profit over the next few months.
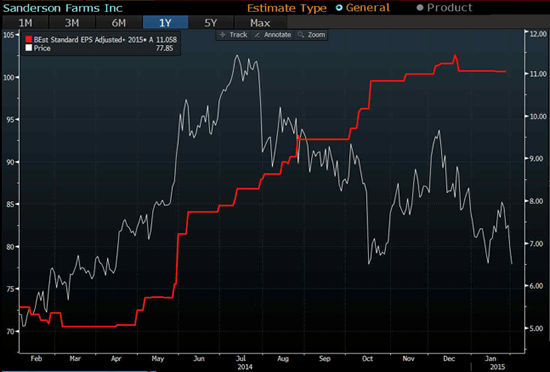
What’s especially striking about the stock’s decline is that shares have been moving against analysts’ increasing EPS estimates:
At just 7.5 times trailing earnings, SAFM’s P/E is near its five-year lows. With the company posting record annual sales and earnings, this screams value to me.
In December, Sanderson announced fiscal 2014 (ended in October) revenue grew 3.4% to $ 2.8 billion, while earnings soared 90% to $ 10.80 per share. For the fourth quarter, the company reported sales were up 4.7% year over year while earnings more than doubled to $ 4.04 per share.
As for the Russian chicken embargo, management addressed it with one sentence on their earnings conference call, saying overall export demand remained relatively steady and export volume was up.
The strong results were driven by increased demand, lower feed costs and higher poultry prices.
Poultry is the No. 1 consumed meat in the United States. According to the USDA, the average American will eat 102.4 pounds of poultry this year, up from 100.3 pounds last year.
At the same time, Sanderson is benefiting from lower costs of the main ingredients in its chicken feed. In the most recent quarter, management said corn prices were down 23.2% from a year earlier and soybean meal was 10.5% lower.
You might think that lower feed costs would result in lower chicken prices. On the contrary, Sanderson reported the price of whole chickens was 7.1% higher than a year ago, jumbo-wing prices were up 5.2% and boneless breast meat jumped 15.8%.
All of these factors are incredibly bullish for the company, yet the stock is still more than 20% off its highs despite some buying activity this week.
I think shares may be on the verge of a turnaround, and the reason lies in a chart anomaly.
The Corn/Sanderson Correlation
Historical correlations and beta help investors understand and quantify the relationship between two or more securities, indices or commodities. They are advanced analytics used by professional money managers to control risk, hedge and profit. For us, they help identify a potential mispricing in the market.
Everyday investors use beta to examine how volatile one security is when compared to another or to an index.
— A beta of 1 tells us that Security A will likely move up about 1% for every 1% that Security B moves up.
— A beta of -1 tell us that Security A will likely move down about 1% for every 1% that Security B moves up.
— A beta of 0 means there’s little correlation between the two.
SAFM typically has a negative beta to the price of corn. This makes sense since corn prices directly impact the profitability of the company. If corn is getting more expensive, it’s logical that Sanderson may make less money and thus experience weakness in its share price, and vice versa.
When a relationship like this breaks down, it’s often because the company is having financial problems. But in Sanderson’s case, the company is reporting record profits, which tells me the breakdown won’t last.
From January 2004 until August 2014, SAFM had a beta of -0.28 to the price of corn on a weekly basis. This means that if corn was down 1%, SAFM was usually up 0.28% that week.
The chart below helps us visualize the inverse beta relationship between SAFM (in white) and corn (in orange).
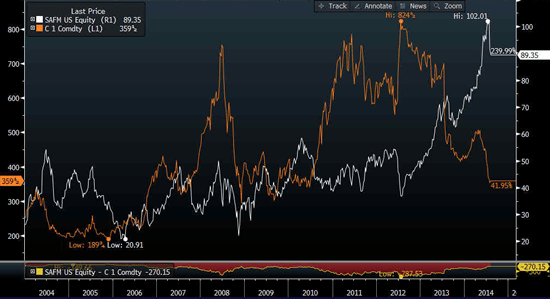
Under “normal” circumstances, SAFM should have gained at least 1.4% from its summer highs since corn lost over 5% of its value since then.
But the negative correlation suddenly fell apart in early August. From August until February, the correlation moved to a +0.15 as SAFM fell along with corn prices.
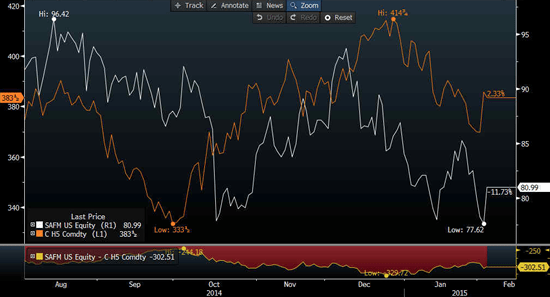
Basically, investors have been selling at a time when the stock should statistically be rallying. Like a rubber band stretched too far, I am anticipating a snapback rally.
There is now an absolute 43% disconnect between the “normal” beta (-0.28) and the recent skewed beta (+0.15) that seems to have started with Russia’s chicken embargo.
With SAFM trading at $ 80.99, I expect a move to $ 90.84, which represents 43% of the $ 22.91 move down from the July highs. Because round numbers tend to be “sticky,” I’m setting my target at $ 90, which is 11% above current prices.
I expect this normalization rally to occur over the next few months as investors come to realize SAFM’s value. To leverage this move, I plan to use a call option strategy.
SAFM Call Option Trade
Today, I am interested in buying SAFM Aug 70 Calls for a limit price of $ 14. (Be sure to use a limit order to get the desired price since the bid-ask spreads are wide.)
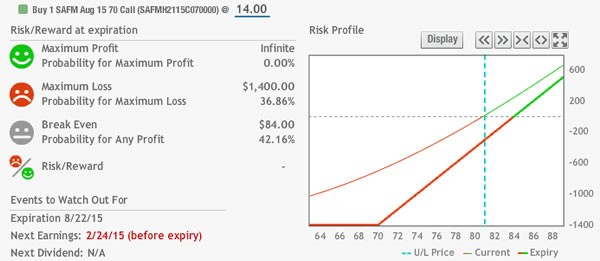
Risk graph courtesy of OptionsHouse.
This call option has a delta of 73, which means it will move roughly $ 0.73 for every dollar that SAFM moves, but it costs a fraction of the price of the stock.
The trade breaks even at $ 84 ($ 70 strike price plus $ 14 options premium), which is 3.7% above current prices.
If SAFM hits my $ 90 upside target, the call options will be worth at least $ 20. Once you enter the trade, place a good ’til cancelled (GTC) order to sell your calls at that price.
Recommended Trade Setup:
— Buy SAFM Aug 70 Calls at $ 14 or less
— Set stop-loss at $ 7
— Set price target at $ 20 for a potential 43% gain in 6.5 months
Options are a great tool for providing the leverage to make double- or triple-digit gains in a matter of weeks or months. But for those of you who prefer to stick to buying and selling stocks, one of my colleagues has an indicator that pegs stocks that can do the same.
In fact, it delivered gains of 83% in just 28 days and as much as 266% in 12 months. He’s offering access to his system to a few hundred people. To learn more about this indicator and get the name of a stock signaling “buy” now, click here.