Is Gold on the Verge of a Major Trend Change?

All major U.S. indices closed in negative territory last week, led by the tech-heavy Nasdaq 100, which ended down 2.1% in January.
As I said in last week’s report, even though the recent sideways trading activity tends to lull people to sleep, this is a time when investors should be paying particularly close attention to day-to-day market movement. These periods of investor indecision typically become the springboard for the next investable intermediate-term trend.
All sectors of the S&P 500 closed lower last week, indicating broad-based weakness. The decline was led by technology, which lost 3.7%. Since tech tends to lead the market both higher and lower, this is not a good sign, at least for the near term.
On the plus side, energy was one of the “least weak” sectors, losing just 1.5%. Moreover, my own ETF-based asset flow metric shows that the biggest inflow of sector bet-related assets during the past weak went into this beleaguered sector, which suggests that — at least relative to the S&P 500 — energy appears to be feeling around for a bottom.
Weakening Momentum Not a Good Sign
Although my work continues to suggest that the U.S. stock market is within weeks of a significant bottom, there is currently no clear evidence that this bottom is in place. On the contrary, price momentum continues to weaken.
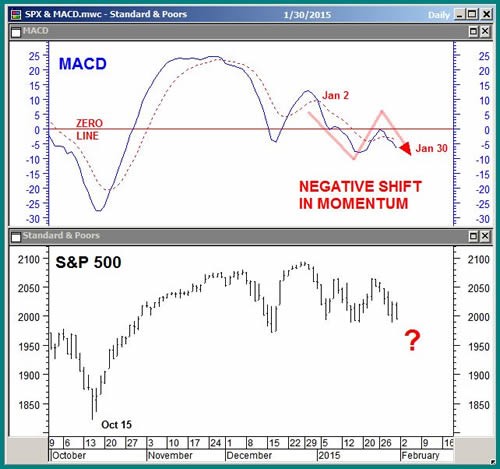
In the Jan. 5 Market Outlook, I pointed out negative momentum divergence in the S&P 500, according to the Moving Average Convergence/Divergence (MACD) indicator, that warned of an upcoming stock market correction. MACD plots the difference between a 12-day and 26-day exponential moving average.
The S&P 500 fell 64 points, or 3.1%, in January, and the chart below shows that momentum has weakened even further. Since Jan. 5, MACD has declined below its zero line, rebounded to test it as overhead resistance, and now appears to be beginning a new leg lower.

Since MACD’s zero line represents a balance point for an asset price’s intermediate-term trend, its recent decline below the line warns of further weakness, potentially similar to that which occurred as the S&P 500 collapsed into its mid-October lows.
Increasing Investor Fear is Another Red Flag
As the stock market is losing positive price momentum, investors are becoming more apprehensive. Neither is good for U.S. equity prices.
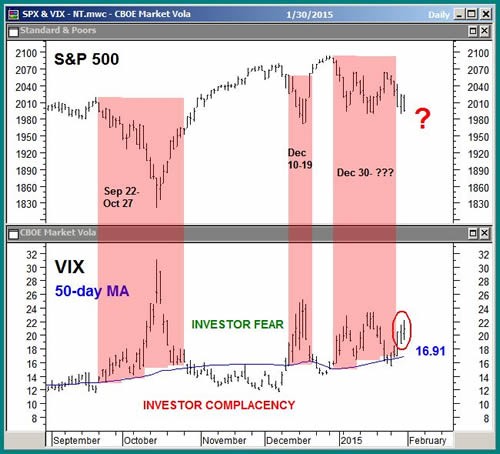
In last week’s report, I said that without a significant decline in the Volatility S&P 500 (VIX) to indicate investors were collectively becoming less fearful, the stock market was vulnerable to more near-term weakness. The VIX has been residing above its 50-day moving average since Dec. 30.

The previous two declines in the S&P 500, in mid-December and during September-October, also took place while the VIX was situated above its 50-day moving average. Until the VIX falls below its 50-day moving average, currently at 16.91, and remains there, it is too early to assume that a sustainable bottom is in place in the stock market.
Major Trend Change in Gold Prices?
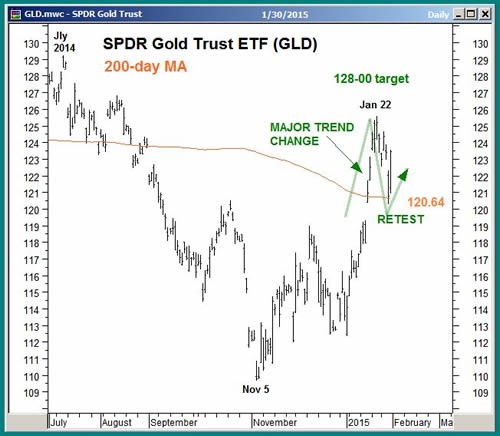
In the Jan. 19 Market Outlook, I said SPDR Gold Shares’ (NYSE: GLD) move above its 200-day moving average, a widely watched major trend proxy, cleared the way for a run to $ 128.
After peaking at $ 125.58 on Jan. 22, GLD declined to retest and rebound from the 200-day moving average, which now becomes underlying support.

So far, this breakout, retest and rebound process is a textbook example of what happens to the price of an asset during an emerging major bullish trend change. As long as the 200-day, currently at $ 120.64, continues to act as underlying support, I expect more strength and for my $ 128 target to eventually be met.
My intermediate-term analysis, looking out one to two quarters, continues to suggest that both the stock market and long-term interest rates are within weeks of a significant bottom, one that will probably be fueled by a continuation of recent strengthening in the U.S. economy.
In the meantime, weakening price momentum in the S&P 500 amid elevated market volatility warns that the broader market is vulnerable to more near-term weakness, which should further support the recent rise in gold prices.
Editor’s note: We finally convinced Amber Hestla to make a training video on her trading technique. She has a 100% success rate going back two years. For the first time, she put together a training webinar called: How I’ve Sold Options With 100% Success.


