
| Symbol | Last | Change | % | High | Low |
|---|---|---|---|---|---|
| SENSEX 30 – INDIA | 74,177.1 | -162.4 | -0.22% | 74,515.9 | 74,102.5 |
| Open Last Trade : 12:10 | India Time : Fri Apr 26 2024 12:10 | ||||
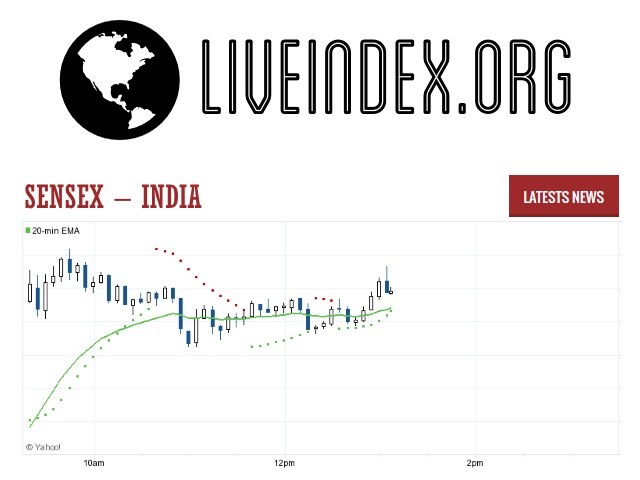
BSE Sensex : Intraday Live Chart
BSE Sensex : Technical Signal Buy & Sell
| 5 Min Signal | 1 Hour Signal | 1 Day Signal |
|---|---|---|
| Neutral | Buy | Buy |
BSE Sensex : Moving Averages
| Period | MA 20 | MA 50 | MA 100 |
|---|---|---|---|
| 5 Minutes | 74263.86 | 74263.86 | 74263.86 |
| 1 Hour | 74231.54 | 73992.49 | 73649.49 |
| 1 Day | 73913.40 | 73551.39 | 72829.89 |
| 1 Week | 72243.53 | 67579.90 | 62833.32 |
BSE Sensex : Technical Resistance Level
| Resistance 1 - R1 | Resistance 2 - R2 | Resistance 3 - r3 |
|---|---|---|
| 74,430.7 | 74,868.0 | 75,445.8 |
BSE Sensex : Technical Support Level
| Support 1 - S1 | Support 2 - S2 | Support 3 - S3 |
|---|---|---|
| 73,415.6 | 72,837.8 | 72,400.5 |
BSE Sensex : Periodical High, Low & Average
| Period | High Change from Last | Low Change from Last | Average Change from Last |
|---|---|---|---|
| 1 Week | 74,571.2 -394.1 | 71,816.5 +2,360.6 | 73,532.6 +644.5 |
| 1 Month | 75,124.3 -947.2 | 71,816.5 +2,360.6 | 73,801.6 +375.5 |
| 3 Month | 75,124.3 -947.2 | 70,319.0 +3,858.1 | 72,993.8 +1,183.3 |
| 6 Month | 75,124.3 -947.2 | 63,093.0 +11,084.1 | 70,810.9 +3,366.2 |
| 1 Year | 75,124.3 -947.2 | 59,954.9 +14,222.2 | 67,821.9 +6,355.2 |
BSE Sensex : Historical Chart
Related News


The S&P BSE SENSEX (S&P Bombay Stock Exchange Sensitive Index), also-called the BSE 30 or simply the SENSEX, is a free-float market capitalization-weighted stock market index of 30 well-established and financially sound companies listed on BSE Ltd. The 30 component companies which are some of the largest and most actively traded stocks, are representative of various industrial sectors of the Indian economy. Published since 1 January 1986, the S&P BSE SENSEX is regarded as the pulse of the domestic stock markets in India. The base value of the S&P BSE SENSEX is taken as 100 on 1 April 1979, and its base year as 1978–79. On 25 July 2001 BSE launched DOLLEX-30, a dollar-linked version of S&P BSE SENSEX. As of 21 April 2011, the market capitalisation of S&P BSE SENSEX was about INR29,733 billion (US$511 billion) (47.68% of market capitalisation of BSE), while its free-float market capitalisation was INR15,690 billion (US$270 billion).
The BSE constantly reviews and modifies its composition to be sure it reflects current market conditions. The index is calculated based on a free float capitalisation method, a variation of the market capitalisation method. Instead of using a company’s outstanding shares it uses its float, or shares that are readily available for trading. As per free float capitalisation methodology, the level of index at any point of time reflects the free float market value of 30 component stocks relative to a base period. The market capitalisation of a company is determined by multiplying the price of its stock by the number of shares issued by of corporate actions, replacement of scrips, etc.
The Sensex has increased by over ten times from June 1990 to the present. Using information from April 1979 onwards, the long-run rate of return on the S&P BSE SENSEX works out to be 18.6% per annum, which translates to roughly 9% per annum.
Sensex - Sensex 30 Index | Sensex 30 Live Quotes | India Index
Live Price of Sensex. Sensex Live Chart, Sensex Intraday & Historical Live Chart. Sensex Buy Sell Signal, Sensex News, Sensex Videos, Sensex Averages, Returns & Historical Data
» Sensex
» Sensex Real Time Quotes
» Sensex Live Chart
» Sensex Intraday Chart
» Sensex Historical Chart
» Sensex Buy Sell Signal
» Sensex News
» Sensex Videos
» Sensex Averages
» Sensex Returns
» Sensex Historical Data