
| Symbol | Last | Change | % | High | Low |
|---|---|---|---|---|---|
| GOLD | 2,349.60 | +7.10 | +0.30% | 2,364.40 | 2,338.00 |
| Close | GMT Time : Sat Apr 27 2024 05:18 | ||||
Gold : Intraday Live Chart
Gold : Technical Signal Buy & Sell
| 5 Min Signal | 1 Hour Signal | 1 Day Signal |
|---|---|---|
| Neutral | Sell | Buy |
Gold : Moving Averages
| Period | MA 20 | MA 50 | MA 100 |
|---|---|---|---|
| 5 Minutes | 2349.60 | 2349.60 | 2349.72 |
| 1 Hour | 2349.89 | 2350.52 | 2344.62 |
| 1 Day | 2369.18 | 2142.06 | 2093.89 |
| 1 Week | 2027.78 | 1989.08 | 1905.11 |
Gold : Technical Resistance Level
| Resistance 1 - R1 | Resistance 2 - R2 | Resistance 3 - r3 |
|---|---|---|
| 2,359.97 | 2,370.95 | 2,386.37 |
Gold : Technical Support Level
| Support 1 - S1 | Support 2 - S2 | Support 3 - S3 |
|---|---|---|
| 2,333.57 | 2,318.15 | 2,307.17 |
Gold : Periodical High, Low & Average
| Period | High Change from Last | Low Change from Last | Average Change from Last |
|---|---|---|---|
| 1 Week | 2,433.30 -83.70 | 2,327.20 +22.40 | 2,358.56 -8.96 |
| 1 Month | 2,448.80 -99.20 | 2,193.70 +155.90 | 2,121.71 +227.89 |
| 3 Month | 2,448.80 -99.20 | 2,004.10 +345.50 | 2,101.62 +247.98 |
| 6 Month | 2,448.80 -99.20 | 1,936.90 +412.70 | 2,063.52 +286.08 |
| 1 Year | 2,448.80 -99.20 | 1,823.50 +526.10 | 2,009.23 +340.37 |
Gold : Historical Chart
Group by:
Related News


About Gold 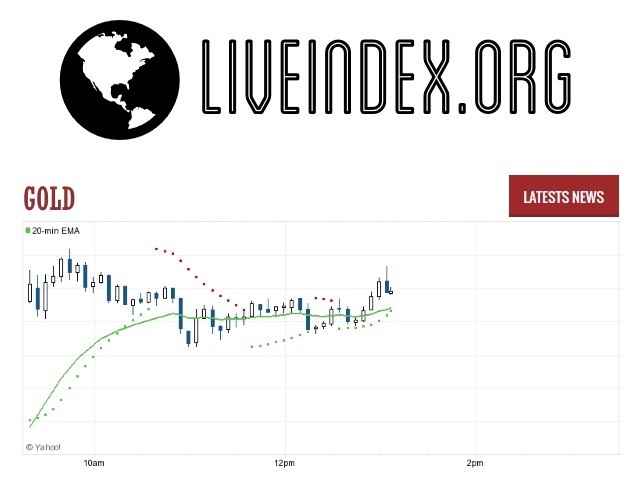
Gold | Gold Prices | Gold Live Quotes | Gold Prices in US Dollar | Gold Live Quotes
Live Price of Gold. Gold Live Chart, Intraday & Historical Chart. Gold Buy & Sell Signal and News & Videos, Gold Averages, Returns & Historical Data
» Gold
» Gold Real Time Quotes
» Gold Live Chart
» Gold Intraday Chart
» Gold Historical Chart
» Gold Buy Sell Signal
» Gold News
» Gold Videos
» Gold Averages
» Gold Currency Pair
» Gold Historical Data