
| Symbol | Last | Change | % | High | Low |
|---|---|---|---|---|---|
| COPPER | 4.5645 | +0.0470 | +1.04% | 4.5985 | 4.5315 |
| Open Last Trade : 15:54 | GMT Time : Fri Apr 26 2024 15:55 | ||||
Copper : Intraday Live Chart
Copper : Technical Signal Buy & Sell
| 5 Min Signal | 1 Hour Signal | 1 Day Signal |
|---|---|---|
| Sell | Buy | Buy |
Copper : Moving Averages
| Period | MA 20 | MA 50 | MA 100 |
|---|---|---|---|
| 5 Minutes | 4.55 | 4.56 | 4.57 |
| 1 Hour | 4.57 | 4.55 | 4.51 |
| 1 Day | 4.36 | 3.93 | 3.87 |
| 1 Week | 3.78 | 3.76 | 3.79 |
Copper : Technical Resistance Level
| Resistance 1 - R1 | Resistance 2 - R2 | Resistance 3 - r3 |
|---|---|---|
| 4.5456 | 4.5496 | 4.5517 |
Copper : Technical Support Level
| Support 1 - S1 | Support 2 - S2 | Support 3 - S3 |
|---|---|---|
| 4.5395 | 4.5374 | 4.5334 |
Copper : Periodical High, Low & Average
| Period | High Change from Last | Low Change from Last | Average Change from Last |
|---|---|---|---|
| 1 Week | 4.5438 +0.0207 | 4.3970 +0.1675 | 4.4810 +0.0835 |
| 1 Month | 4.5438 +0.0207 | 4.0012 +0.5633 | 3.8780 +0.6865 |
| 3 Month | 4.5438 +0.0207 | 3.6550 +0.9095 | 3.8792 +0.6853 |
| 6 Month | 4.5438 +0.0207 | 3.5810 +0.9835 | 3.8321 +0.7324 |
| 1 Year | 4.5438 +0.0207 | 3.5465 +1.0180 | 3.7963 +0.7682 |
Copper : Historical Chart
Group by:
Related News


About Copper 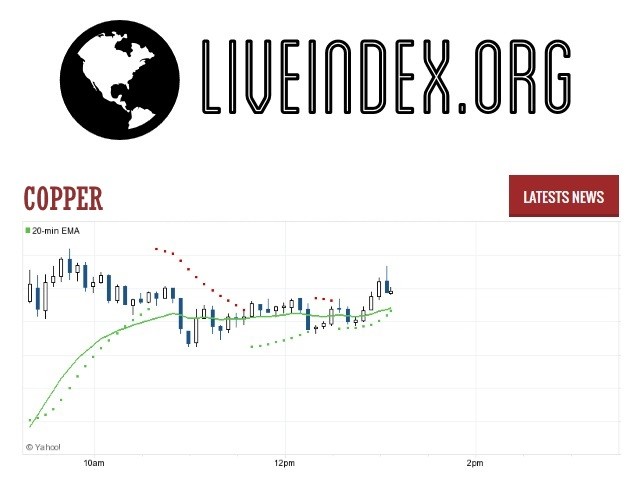
Copper | Copper Prices | Copper Live Quotes | Copper Prices in US Dollar | Copper Live Quotes
Live Price of Copper. Copper Live Chart, Intraday & Historical Chart. Copper Buy & Sell Signal and News & Videos, Copper Averages, Returns & Historical Data
» Copper
» Copper Real Time Quotes
» Copper Live Chart
» Copper Intraday Chart
» Copper Historical Chart
» Copper Buy Sell Signal
» Copper News
» Copper Videos
» Copper Averages
» Copper Currency Pair
» Copper Historical Data