
| Symbol | Last | Change | % | High | Low |
|---|---|---|---|---|---|
| USD / RUB | 77.071 | -0.550 | -0.71% | 0.000 | 0.000 |
| Close | GMT Time : Mon Apr 13 2026 04:01 | ||||
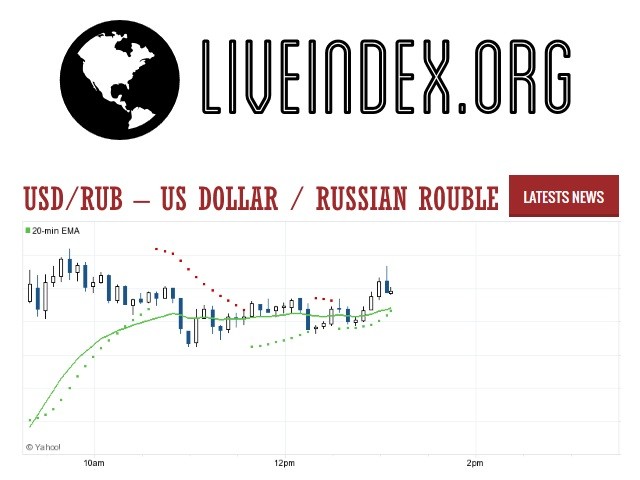
USD/RUB : Intraday Live Chart
USD/RUB : Technical Signal Buy & Sell
| 5 Min Signal | 1 Hour Signal | 1 Day Signal |
|---|---|---|
| Neutral | Sell | Buy |
USD/RUB : Moving Averages
| Period | MA 20 | MA 50 | MA 100 |
|---|---|---|---|
| 5 Minutes | 0.00 | 0.00 | 0.00 |
| 1 Hour | 77.23 | 77.73 | 78.15 |
| 1 Day | 79.86 | 78.42 | 78.14 |
| 1 Week | 78.50 | 79.67 | 86.15 |
USD/RUB : Technical Resistance Level
| Resistance 1 - R1 | Resistance 2 - R2 | Resistance 3 - r3 |
|---|---|---|
| 0.000 | 0.000 | 0.000 |
USD/RUB : Technical Support Level
| Support 1 - S1 | Support 2 - S2 | Support 3 - S3 |
|---|---|---|
| 0.000 | 0.000 | 0.000 |
USD/RUB : Periodical High, Low & Average
| Period | High Change from Last | Low Change from Last | Average Change from Last |
|---|---|---|---|
| 1 Week | 0.000 +77.071 | 0.000 +77.071 | 77.828 -0.758 |
| 1 Month | 0.000 +77.071 | 0.000 +77.071 | 79.864 -2.794 |
| 3 Month | 79.150 -2.080 | 0.000 +77.071 | 77.878 -0.808 |
| 6 Month | 81.250 -4.180 | 0.000 +77.071 | 78.787 -1.717 |
| 1 Year | 82.250 -5.180 | 0.000 +77.071 | 79.714 -2.644 |
USD/RUB : Historical Chart
Related News


USD to RUB Exchange Rate: Long-Term Trends and Historical Volatility
The USD/RUB exchange rate, which represents how many Russian rubles are needed to purchase one U.S. dollar, is one of the most geopolitically sensitive currency pairs in the foreign exchange market. Over the last century, it has been shaped by regime changes, oil price shocks, war, inflation, sanctions, and central bank interventions. For currency traders, economists, and global investors, understanding the ruble’s long-term trajectory offers valuable insights into Russia’s monetary stability and its standing in the global economy.
The Soviet Era: Artificial Stability and Closed Currency (Before 1991)
During the Soviet era, the ruble (SUR) was non-convertible in the global market. The official exchange rate was set by the state and often didn’t reflect real-world value. For most of the 20th century, there was no transparent or market-driven USD/RUB rate. Instead, black market exchange rates in international hubs (such as Berlin, Helsinki, or even inside Soviet bloc embassies) suggested a substantial disparity between the official rate and actual demand.
By the 1980s, the official exchange rate stood at around 0.6 RUB/USD, but unofficial rates placed it anywhere between 5 to 30 RUB/USD, depending on demand for dollars and political circumstances. The ruble was considered non-fungible, and holding foreign currency was restricted for private citizens.
The Collapse of the USSR and Hyperinflation (1991–1999)
The fall of the Soviet Union in 1991 marked a seismic shift in Russia’s economic policy. With the introduction of a market economy, the ruble was allowed to float—revealing its true weakness against the dollar. Between 1992 and 1997, the ruble lost almost all of its purchasing power, plunging from around 125 RUB/USD to over 5,960 RUB/USD before redenomination.
In 1998, the Russian economy faced a devastating financial crisis triggered by a crash in oil prices, fiscal mismanagement, and investor flight. Russia defaulted on domestic debt, and the ruble collapsed. The government redenominated the currency by removing three zeros, so 1,000 old rubles became 1 new ruble (RUB). By the end of 1999, the exchange rate was about 27 RUB/USD.
This decade was marked by hyperinflation, the erosion of public trust in banking, and a reliance on foreign financial aid.
The Oil-Led Recovery and Ruble Stabilization (2000–2009)
The 2000s were much more stable for the Russian economy. The rise in global oil prices fueled strong GDP growth and helped rebuild Russia’s foreign currency reserves. Under President Vladimir Putin’s leadership, inflation was brought under control, and the ruble began to recover in relative terms.
Between 2000 and 2008, the ruble traded in a relatively tight range of 23–30 RUB/USD. The Russian central bank maintained a managed float, intervening in currency markets to prevent excessive volatility. In 2008, the ruble even strengthened to 23.3 RUB/USD before the global financial crisis hit, forcing a devaluation.
By the end of 2009, the rate had slipped back to 30 RUB/USD, but Russia emerged from the crisis with less damage than Western economies, due in part to its conservative debt profile and commodity exports.
Sanctions, War, and Economic Retrenchment (2010–2019)
The 2010s introduced intense geopolitical friction, notably with the annexation of Crimea in 2014. Western nations responded with coordinated economic sanctions, blocking access to global capital markets and freezing Russian assets. Simultaneously, oil prices tumbled, from over $100/barrel in mid-2014 to below $50 by early 2015.
The USD/RUB pair skyrocketed from 33 RUB/USD in early 2014 to nearly 70 RUB/USD by year-end, with a short-lived spike beyond 80 RUB/USD during the panic of December 2014. Russia’s central bank responded by moving to a free-floating ruble policy, implementing emergency rate hikes, and tightening capital controls.
From 2016 to 2019, the ruble stabilized slightly, trading in the 60–67 RUB/USD range, supported by a modest recovery in oil and better fiscal management. However, lingering sanctions and capital outflows kept the ruble from regaining its earlier strength.
Ukraine War, Sanctions Shock, and Ruble Engineering (2020–Present)
The 2020s opened with the COVID-19 pandemic, which caused temporary pressure on the ruble as oil demand collapsed. By 2021, the exchange rate averaged around 74–75 RUB/USD.
In February 2022, Russia launched a full-scale invasion of Ukraine, prompting unprecedented financial sanctions from the U.S., EU, and allies. Major Russian banks were cut off from SWIFT, the central bank’s reserves were frozen, and Western businesses exited the market. The ruble plummeted to 138 RUB/USD in early March 2022.
Yet, Russia executed one of the most extreme examples of financial isolationism to save its currency:
Mandatory conversion of foreign earnings
Capital controls
Gas-for-rubles policy
Key interest rate hikes
Surprisingly, by mid-2022, the ruble had bounced back to under 60 RUB/USD, momentarily becoming the best-performing currency globally. However, this was artificial strength caused by low convertibility and limited free market access.
By 2023 and into 2024, continued war expenses, falling energy exports, and growing isolation put downward pressure on the ruble again. As of April 2025, the USD/RUB exchange rate is approximately 93.2, showing long-term depreciation even under tight monetary control.
Decade-wise USD to RUB Exchange Rate Table
| Decade | Avg. Exchange Rate | Change from Previous Decade |
|---|---|---|
| 1950s | Fixed / Not Convertible | ❔ Not Applicable |
| 1960s | Fixed / Not Convertible | ❔ Not Applicable |
| 1970s | Est. 1–2 (Black Market) | ❌ -60% (real depreciation) |
| 1980s | Est. 10–30 (Black Market) | ❌ -85% depreciation |
| 1990s | 6,000 → 27 (Redenominated) | ❌ -99.5% depreciation |
| 2000s | 25–30 | 🟢 +10% appreciation |
| 2010s | 60–70 | ❌ -55% depreciation |
| 2020s (till 2025) | 75–93.2 | ❌ -25% depreciation |
✅ Key:
🟢 = Ruble appreciation vs. USD
❌ = Ruble depreciation
❔ = No market-driven rate available
USD/RUB - US Dollar / Russian Ruble Currency Rate
Live Price of USD/RUB. USD/RUB Live Chart, Intraday & Historical Live Chart, Buy Sell Signal, USD/RUB News, USD/RUB Averages, Returns & Historical Data
» USD/RUB
» USD/RUB Real Time Quotes
» USD/RUB Live Chart
» USD/RUB Intraday Chart
» USD/RUB Historical Chart
» USD/RUB Buy Sell Signal
» USD/RUB News
» USD/RUB Videos
» USD/RUB Averages
» USD/RUB Currency Pair
» USD/RUB Historical Data