
| Symbol | Last | Change | % | High | Low |
|---|---|---|---|---|---|
| USD / MXN | 17.403 | +0.113 | +0.65% | 17.441 | 17.403 |
| Open Last Trade : 02:14 | GMT Time : Mon Apr 13 2026 02:14 | ||||
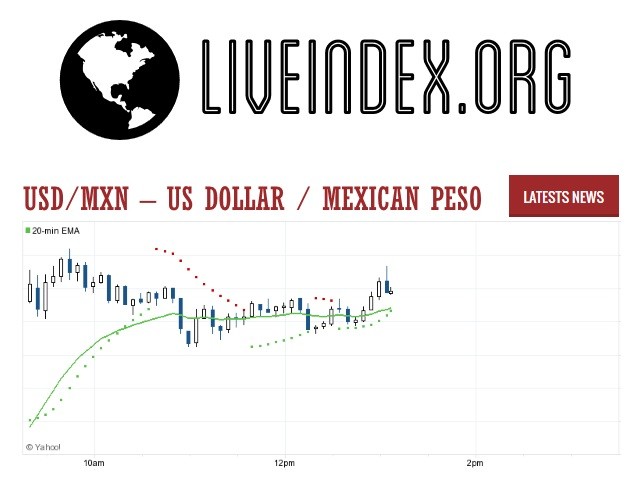
USD/MXN : Intraday Live Chart
USD/MXN : Technical Signal Buy & Sell
| 5 Min Signal | 1 Hour Signal | 1 Day Signal |
|---|---|---|
| Sell | Buy | Buy |
USD/MXN : Moving Averages
| Period | MA 20 | MA 50 | MA 100 |
|---|---|---|---|
| 5 Minutes | 17.41 | 17.42 | 17.42 |
| 1 Hour | 17.31 | 17.29 | 17.16 |
| 1 Day | 17.76 | 17.52 | 17.59 |
| 1 Week | 17.79 | 18.41 | 18.54 |
USD/MXN : Technical Resistance Level
| Resistance 1 - R1 | Resistance 2 - R2 | Resistance 3 - r3 |
|---|---|---|
| 17.432 | 17.438 | 17.452 |
USD/MXN : Technical Support Level
| Support 1 - S1 | Support 2 - S2 | Support 3 - S3 |
|---|---|---|
| 17.412 | 17.397 | 17.391 |
USD/MXN : Periodical High, Low & Average
| Period | High Change from Last | Low Change from Last | Average Change from Last |
|---|---|---|---|
| 1 Week | 17.770 -0.367 | 0.000 +17.403 | 17.441 -0.038 |
| 1 Month | 18.154 -0.751 | 0.000 +17.403 | 17.759 -0.356 |
| 3 Month | 18.154 -0.751 | 0.000 +17.403 | 17.489 -0.086 |
| 6 Month | 18.699 -1.296 | 0.000 +17.403 | 17.889 -0.486 |
| 1 Year | 20.315 -2.912 | 0.000 +17.403 | 18.420 -1.017 |
USD/MXN : Historical Chart
Related News


USD to MXN Exchange Rate: Historical Performance and Long-Term Overview
The USD/MXN exchange rate, which reflects how many Mexican pesos are needed to purchase one U.S. dollar, is one of the most actively traded currency pairs in Latin America. Over the past century, this pair has undergone extreme swings, driven by economic reform, inflation, oil shocks, financial crises, and more recently, global trade flows and monetary policy divergence between the U.S. Federal Reserve and Banco de México.
Understanding the long-term trends of USD to MXN is crucial for currency traders, businesses engaged in U.S.-Mexico trade, and investors looking at emerging market exposure.
Pre-1980s: A Pegged and Controlled Peso
Before 1976, Mexico operated under a fixed exchange rate regime, pegging the peso to the U.S. dollar. From the early 1900s through the 1950s, the rate hovered around 4 to 5 pesos per USD, with minor adjustments. This period of exchange rate stability allowed for moderate economic growth but hid underlying structural issues.
In the 1970s, global inflation and the oil crisis strained the Mexican economy. Mexico had large public debts and increasing fiscal deficits. Despite the government’s attempts to maintain the peso’s peg, pressure mounted. In 1976, Mexico was forced to devalue the peso from 12.5 to 20.5 per USD, ending its long-standing fixed rate. This marked the beginning of a series of currency shocks that would continue into the 1990s.
1980s: The Debt Crisis and Peso Collapse
The 1980s were defined by Mexico’s sovereign debt crisis. In 1982, Mexico declared it could no longer service its external debt, triggering a financial meltdown. As a result, the Mexican peso experienced hyper-depreciation.
By the end of the decade, the USD/MXN exchange rate ballooned from 26 pesos per dollar in 1982 to nearly 2,300 pesos per dollar in 1989. Inflation peaked above 150%, and the peso lost nearly 99% of its value in just ten years. Capital controls and multiple exchange rate regimes failed to stabilize the currency.
1990s: Tequila Crisis and Currency Redenomination
To address runaway inflation and depreciation, Mexico redenominated the peso in 1993, removing three zeros. The “nuevo peso” (MXN) was introduced at a rate of 1,000 old pesos = 1 new peso. This move gave birth to the modern USD/MXN exchange rate that we observe today.
However, stabilization was short-lived. In 1994, the Tequila Crisis erupted after the assassination of a presidential candidate and a loss of investor confidence. A sudden devaluation of the peso from 3.4 to over 7.5 MXN/USD within weeks triggered a financial contagion across Latin America. The U.S. had to organize a $50 billion bailout to prevent default.
By the end of the 1990s, the exchange rate had settled around 9.5–10.0 MXN/USD, but long-term volatility remained a structural feature of the peso.
2000s: Growth, NAFTA Influence, and Peso Recovery
The 2000s were a relatively stable decade for the Mexican economy and its currency. Increased trade through NAFTA, robust remittance flows, and prudent fiscal management helped the peso maintain a consistent range of 9 to 11.5 MXN/USD for much of the decade.
In 2008, the global financial crisis caused risk aversion across emerging markets. The peso briefly dropped to 15.5 MXN/USD, reflecting capital flight and global uncertainty. However, by 2009–2010, the currency regained some strength, stabilizing around 12.5.
Banco de México’s shift toward inflation targeting and independent monetary policy helped boost the credibility of the currency.
2010s: Oil Dependency, Trump, and Structural Pressures
The 2010s saw the USD/MXN rate exhibit heightened sensitivity to both domestic politics and international trade dynamics. The pair ranged between 12.5 to 20.0 MXN/USD, with notable volatility during:
The oil price crash of 2014–2016, when crude prices fell from $100 to below $30, heavily impacting Mexico’s export revenues.
The 2016 U.S. presidential election, where fears over NAFTA renegotiation and border tariffs sent the peso to a record low of 21.5 MXN/USD following Donald Trump’s victory.
Despite this, Mexico’s strong macroeconomic framework, floating exchange rate regime, and credible inflation targeting helped limit the downside for the peso compared to other emerging market currencies.
By 2019, the pair traded near 18.5, signaling partial recovery.
2020s: Pandemic, Rate Hikes, and Peso Resilience
The COVID-19 pandemic hit Mexico hard in early 2020, both in health and economic terms. The peso crashed from 18.5 to 25.7 MXN/USD in March 2020—its weakest level ever recorded. This was driven by global panic, a halt in tourism and exports, and falling oil demand.
However, the peso’s rebound post-2020 surprised many analysts. Thanks to early rate hikes by Banco de México, surging remittances from the U.S., and resilient exports, the peso began to appreciate. By early 2023, the rate fell below 19.0 MXN/USD, and in 2024, even touched 17.0 at one point.
As of April 2025, the USD/MXN exchange rate stands at approximately 16.65, reflecting growing investor confidence in Mexico’s fiscal discipline and its strategic role in nearshoring supply chains away from Asia.
USD to MXN: Decade-Wise Exchange Rate Table
| Decade | Avg. Exchange Rate | Change from Previous Decade |
|---|---|---|
| 1950s | 8.65 MXN/USD (fixed) | ❔ Not Applicable |
| 1960s | 12.5 MXN/USD (fixed) | ❌ -31% depreciation |
| 1970s | 20.5 MXN/USD | ❌ -39% depreciation |
| 1980s | 2,300 MXN/USD (pre-redenom.) | ❌ -99% depreciation |
| 1990s | 3.5 → 9.5 MXN/USD | ❌ -60% depreciation |
| 2000s | 9.5 → 13.0 MXN/USD | ❌ -25% depreciation |
| 2010s | 12.5 → 19.5 MXN/USD | ❌ -35% depreciation |
| 2020s (till 2025) | 25.7 → 16.65 MXN/USD | 🟢 +35% appreciation |
✅ Key:
🟢 = Peso appreciation vs. USD
❌ = Peso depreciation
❔ = No market-driven data available
USD/MXN - US Dollar / Mexican Peso Currency Rate
Live Price of USD/MXN. USD/MXN Live Chart, Intraday & Historical Live Chart, Buy Sell Signal, USD/MXN News, USD/MXN Averages, Returns & Historical Data
» USD/MXN
» USD/MXN Real Time Quotes
» USD/MXN Live Chart
» USD/MXN Intraday Chart
» USD/MXN Historical Chart
» USD/MXN Buy Sell Signal
» USD/MXN News
» USD/MXN Videos
» USD/MXN Averages
» USD/MXN Currency Pair
» USD/MXN Historical Data