| Symbol | Last | Change | % | High | Low |
|---|---|---|---|---|---|
| USD / KRW | 1,443.78 | -12.69 | -0.87% | 1,460.64 | 1,444.00 |
| Open Last Trade : 17:25 | GMT Time : Wed Feb 11 2026 17:25 | ||||
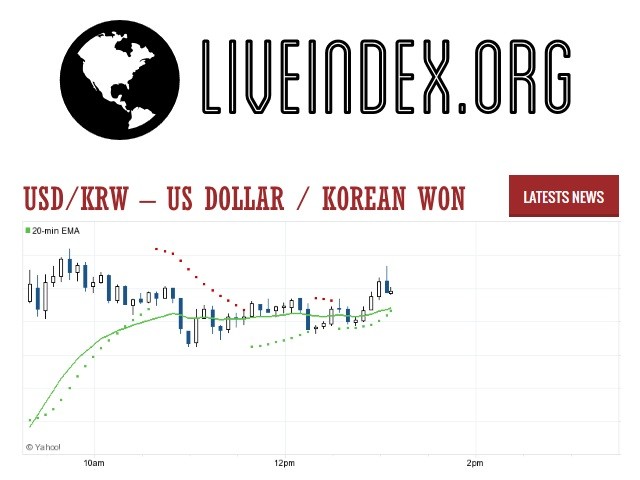
USD/KRW : Intraday Live Chart
USD/KRW : Technical Signal Buy & Sell
| 5 Min Signal | 1 Hour Signal | 1 Day Signal |
|---|---|---|
| Sell | Sell | Sell |
USD/KRW : Moving Averages
| Period | MA 20 | MA 50 | MA 100 |
|---|---|---|---|
| 5 Minutes | 1447.72 | 1450.35 | 1450.15 |
| 1 Hour | 1452.78 | 1455.92 | 1459.72 |
| 1 Day | 1452.29 | 1454.45 | 1459.48 |
| 1 Week | 1446.65 | 1419.15 | 1391.28 |
USD/KRW : Technical Resistance Level
| Resistance 1 - R1 | Resistance 2 - R2 | Resistance 3 - r3 |
|---|---|---|
| 1,459.67 | 1,461.30 | 1,463.91 |
USD/KRW : Technical Support Level
| Support 1 - S1 | Support 2 - S2 | Support 3 - S3 |
|---|---|---|
| 1,455.43 | 1,452.82 | 1,451.19 |
USD/KRW : Periodical High, Low & Average
| Period | High Change from Last | Low Change from Last | Average Change from Last |
|---|---|---|---|
| 1 Week | 1,472.40 -28.62 | 0.00 +1,443.78 | 1,462.63 -18.85 |
| 1 Month | 1,480.12 -36.34 | 0.00 +1,443.78 | 1,458.18 -14.40 |
| 3 Month | 1,482.74 -38.96 | 0.00 +1,443.78 | 1,460.77 -16.99 |
| 6 Month | 1,482.74 -38.96 | 0.00 +1,443.78 | 1,434.53 +9.25 |
| 1 Year | 1,486.13 -42.35 | 0.00 +1,443.78 | 1,419.65 +24.13 |
USD/KRW : Historical Chart
USD to KRW Exchange Rate: A Historical Overview and Long-Term Performance
The USD/KRW exchange rate — representing how many South Korean won are needed to buy one U.S. dollar — is a critical indicator for traders, investors, and policy watchers in the Asia-Pacific region. As South Korea evolved from a war-torn agrarian society into a global technological powerhouse, its currency experienced a complex journey marked by rapid growth, crises, and market reforms.
The long-term trend of the Korean won vs. U.S. dollar reflects shifts in global trade, interest rate differentials, geopolitical tensions, and changes in South Korea’s economic framework. Understanding this evolution helps decode both past market behavior and future expectations.
1950s–1970s: Pegged Regime and Industrial Foundation
Following the Korean War (1950–1953), South Korea faced economic devastation. In the initial years, the Korean won (KRW) was pegged to the U.S. dollar under a fixed exchange rate system. In 1953, the exchange rate was set at 15 KRW/USD, but severe inflation and economic instability led to frequent adjustments.
By the late 1960s, with export-led industrialization taking off, the rate was revised to 400 KRW/USD. This pegged but adjustable regime helped South Korea maintain price stability while building its economic foundation, especially in electronics, shipbuilding, and textiles.
1980s: From Peg to Managed Float
The 1980s saw increased pressure to move toward a more flexible exchange rate system due to rising trade volumes and market liberalization. By 1980, the USD/KRW rate had reached around 600 KRW/USD, but capital controls still heavily influenced price discovery.
By 1988, South Korea formally switched to a managed floating exchange rate system. This was in response to growing external trade imbalances and increasing global demand for floating currencies following the Plaza Accord. The average exchange rate during this decade rose to 680 KRW/USD, reflecting ongoing adjustments amid growing trade surpluses.
1990s: Asian Financial Crisis and Currency Turmoil
In the early 1990s, the Korean economy boomed. However, rapid liberalization, corporate over-leverage, and weak financial regulation culminated in the 1997 Asian Financial Crisis. The Korean won, like other regional currencies, collapsed as investor confidence evaporated.
In November 1997, the USD/KRW rate surged from 900 to over 1,960 within weeks, a depreciation of more than 50%. The International Monetary Fund (IMF) stepped in with a $58 billion bailout package — the largest in history at the time.
By the end of the 1990s, the exchange rate had somewhat stabilized at ~1,200 KRW/USD, but the crisis permanently altered South Korea’s financial architecture. Major reforms were introduced, including increased central bank independence, tighter corporate governance, and deeper currency market liberalization.
2000s: Recovery and Stabilization
The 2000s were characterized by post-crisis recovery and a period of relative exchange rate stability. South Korea became a key player in global electronics, with firms like Samsung, LG, and Hyundai becoming internationally dominant.
The USD/KRW rate during this time fluctuated between 950 and 1,200, driven largely by global interest rate cycles, oil prices, and foreign portfolio flows. Despite occasional volatility, the Korean won remained relatively stable due to sound macroeconomic fundamentals and high foreign exchange reserves.
The 2008 global financial crisis caused a brief spike in the rate from 930 to over 1,500 KRW/USD, reflecting global risk aversion. But the recovery was swift, with the rate falling back below 1,200 by 2010.
2010s: Export Resilience, Fed Policy, and Regional Tensions
The 2010s were marked by modest appreciation pressures on the won, thanks to a strong current account surplus and booming exports, particularly in semiconductors and electronics. However, the USD/KRW pair was also affected by the Federal Reserve’s interest rate policy, rising geopolitical risks (especially involving North Korea), and shifts in global supply chains.
From 2010 to 2015, the exchange rate hovered between 1,050 and 1,200 KRW/USD, with occasional spikes due to North Korean missile tests or U.S.-China trade tensions. A stronger U.S. dollar and Federal Reserve tightening in 2018 pushed the rate back toward 1,180–1,200 by the end of the decade.
Despite periodic volatility, the decade closed with the South Korean won holding strong in regional comparison, backed by its tech-driven economy and disciplined monetary policy.
2020s: Pandemic Shock, Inflation, and Central Bank Divergence
The COVID-19 pandemic in 2020 caused a sharp sell-off in emerging market currencies. The USD/KRW exchange rate jumped from 1,170 to over 1,285 within weeks. South Korea’s strong fiscal position and early control of the pandemic helped limit long-term damage, but global inflation and interest rate divergence created renewed currency pressure.
In 2022–2023, as the Federal Reserve aggressively hiked rates to combat U.S. inflation, the Korean won weakened again, touching 1,440 KRW/USD — its weakest level since 2009. However, the Bank of Korea responded with synchronized rate increases, stabilizing the won by late 2023.
As of April 2025, the USD/KRW exchange rate stands at approximately 1,330, reflecting improved investor sentiment, stable inflation in Korea, and expectations of dovish shifts in U.S. monetary policy.
USD to KRW: Decade-Wise Exchange Rate Table
| Decade | Avg. Exchange Rate | Change from Previous Decade |
|---|---|---|
| 1950s | 15 → 65 KRW/USD (fixed peg) | ❌ -76% depreciation |
| 1960s | 130 → 400 KRW/USD | ❌ -70% depreciation |
| 1970s | 400 → 600 KRW/USD | ❌ -33% depreciation |
| 1980s | 600 → 680 KRW/USD | ❌ -13% depreciation |
| 1990s | 700 → 1,200 KRW/USD | ❌ -42% depreciation |
| 2000s | 950 → 1,200 KRW/USD | ❌ -21% depreciation |
| 2010s | 1,050 → 1,180 KRW/USD | ❌ -12% depreciation |
| 2020s (till 2025) | 1,285 → 1,330 KRW/USD | ❌ -3.5% depreciation |
✅ Key:
🟢 = Won appreciation vs. USD
❌ = Won depreciation
❔ = Not applicable
USD/KRW - US Dollar / South Korean Won Exchange Rate
Live Price of USD/KRW. USD/KRW Live Chart, Intraday & Historical Live Chart, Buy Sell Signal, USD/KRW News, USD/KRW Averages, Returns & Historical Data
» USD/KRW
» USD/KRW Real Time Quotes
» USD/KRW Live Chart
» USD/KRW Intraday Chart
» USD/KRW Historical Chart
» USD/KRW Buy Sell Signal
» USD/KRW News
» USD/KRW Videos
» USD/KRW Averages
» USD/KRW Currency Pair
» USD/KRW Historical Data

