
| Symbol | Last | Change | % | High | Low |
|---|---|---|---|---|---|
| USD / CNY | 6.8314 | +0.0027 | +0.04% | 6.8420 | 6.8320 |
| Close | GMT Time : Thu Apr 09 2026 20:23 | ||||
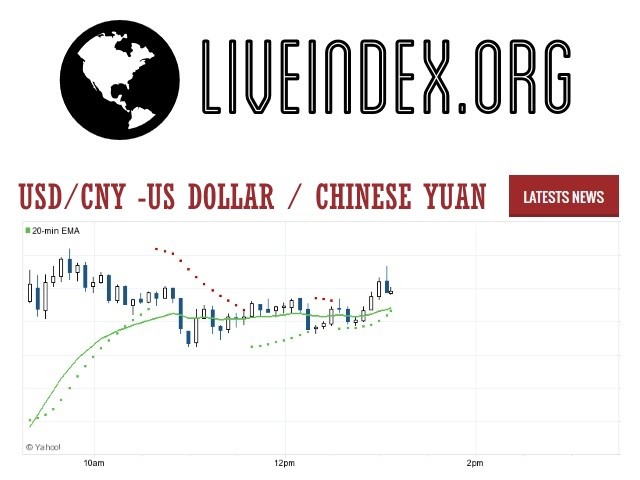
USD/CNY : Intraday Live Chart
USD/CNY : Technical Signal Buy & Sell
| 5 Min Signal | 1 Hour Signal | 1 Day Signal |
|---|---|---|
| Sell | Sell | Sell |
USD/CNY : Moving Averages
| Period | MA 20 | MA 50 | MA 100 |
|---|---|---|---|
| 5 Minutes | 6.51 | 6.70 | 6.77 |
| 1 Hour | 6.51 | 6.70 | 6.79 |
| 1 Day | 6.89 | 6.89 | 6.94 |
| 1 Week | 6.98 | 7.10 | 7.16 |
USD/CNY : Technical Resistance Level
| Resistance 1 - R1 | Resistance 2 - R2 | Resistance 3 - r3 |
|---|---|---|
| 0.0000 | 0.0000 | 0.0000 |
USD/CNY : Technical Support Level
| Support 1 - S1 | Support 2 - S2 | Support 3 - S3 |
|---|---|---|
| 0.0000 | 0.0000 | 0.0000 |
USD/CNY : Periodical High, Low & Average
| Period | High Change from Last | Low Change from Last | Average Change from Last |
|---|---|---|---|
| 1 Week | 0.0000 +6.8314 | 0.0000 +6.8314 | 6.8692 -0.0378 |
| 1 Month | 0.0000 +6.8314 | 0.0000 +6.8314 | 6.8865 -0.0551 |
| 3 Month | 0.0000 +6.8314 | 0.0000 +6.8314 | 6.9172 -0.0858 |
| 6 Month | 0.0000 +6.8314 | 0.0000 +6.8314 | 7.0035 -0.1721 |
| 1 Year | 7.1835 -0.3521 | 0.0000 +6.8314 | 7.0977 -0.2663 |
USD/CNY : Historical Chart
Related News


USD to CNY Exchange Rate History: From Pegged Yuan to Strategic Currency Policy
The USD to CNY exchange rate—the value of the U.S. dollar against the Chinese yuan—is one of the most geopolitically significant and economically complex currency pairs in the world. Unlike fully free-floating currencies, the yuan (CNY) has long been subject to central control, making its historical trajectory deeply tied to China’s domestic policy, U.S.–China trade relations, and global macroeconomic trends.
Understanding the USD/CNY historical trend provides important insights into China’s economic evolution, export strategy, interest rate parity, and exchange rate regime shifts. Traders, economists, and policy watchers closely monitor this pair for its impact on trade balances, inflation dynamics, and reserve currency strategies.
1980s–1993: Initial Currency Liberalization and High Volatility
China began economic reforms in 1978, transitioning from a closed planned economy to one open to trade. Before 1981, China used an official dual exchange rate system, with official and swap rates that differed dramatically. The yuan was heavily overvalued, discouraging exports.
In the 1980s, China devalued the yuan several times to encourage trade competitiveness. In 1981, USD/CNY was fixed at 2.80, but by 1985, it had devalued to 3.20. This trend continued as China opened more to foreign investment and needed a competitive rate for its exports.
In 1993, the authorities unified the dual exchange system, moving toward a more market-oriented rate. At that point, the yuan fell sharply, and the exchange rate reached 8.70, effectively devaluing the currency to match market conditions.
1994–2004: Pegging the Yuan and Building Export Might
In 1994, China officially pegged the yuan to the U.S. dollar at approximately 8.28, maintaining this rate for the next decade. This policy was instrumental in supporting China’s export-led growth model.
During this time, China accumulated massive foreign exchange reserves by running large trade surpluses with the U.S. and Europe. Critics accused China of currency manipulation, keeping the yuan undervalued to maintain competitive exports.
Between 1994 and 2004, the USD/CNY exchange rate remained remarkably stable, despite global currency fluctuations. The fixed rate gave investors and businesses predictability, but it also built political tensions, especially with the U.S. Congress urging China to float its currency.
2005–2013: Managed Float and Gradual Yuan Appreciation
In July 2005, China surprised global markets by moving away from the dollar peg. The People’s Bank of China (PBOC) announced a “managed floating exchange rate system” referencing a basket of currencies.
The yuan began a slow, controlled appreciation. By 2008, the exchange rate had moved from 8.28 to 6.83, a nearly 20% gain for the yuan. However, following the 2008 global financial crisis, the PBOC paused appreciation to stabilize exports.
From 2010 to 2013, as the global economy recovered, China resumed yuan appreciation, and the USD/CNY rate fell to around 6.10 by early 2014.
This period reflected China’s dual goal of maintaining export strength while responding to global pressure to let its currency rise more freely.
2014–2019: Currency Reforms, Capital Controls, and Devaluation Shock
In August 2015, China made a surprise move to devalue the yuan by 2% in one day, citing the need for a more market-driven fixing mechanism. This move sent shockwaves through global markets, triggering selloffs across Asia and emerging markets.
From 2015 to 2016, capital outflows surged, prompting China to implement strict capital controls to prevent yuan depreciation. The exchange rate moved from 6.20 to over 6.95 during this period.
By 2017–2018, the yuan had regained some strength, briefly touching 6.25 before the U.S.–China trade war escalated. Tariff tensions and political uncertainty pushed the yuan back above 7.00 for the first time in over a decade.
2020–2024: Pandemic Volatility, Tech Tensions, and Policy Divergence
The COVID-19 pandemic initially triggered a yuan selloff in early 2020, but China’s faster recovery helped the yuan appreciate strongly through 2021. By early 2022, the USD/CNY rate had fallen to 6.35.
However, by late 2022 and into 2023, the Federal Reserve’s aggressive rate hikes contrasted with China’s accommodative monetary policy, putting pressure on the yuan. The USD/CNY rate surged above 7.30 by late 2023, the weakest level in nearly 15 years.
China’s economic rebound has been uneven, with persistent real estate sector problems, weaker consumer spending, and geopolitical headwinds. As of April 2025, the USD/CNY trades near 7.20, reflecting subdued global demand, diverging central bank policies, and China’s export strategy.
✅ Key:
🟢 = Yuan appreciated vs USD
❌ = Yuan depreciated vs USD
⚠️ = Minimal change / Flat
📊 USD to CNY Exchange Rate by Decade
| Decade | Avg. USD/CNY Rate (Approx) | Change vs. Previous Decade | Key Events |
|---|---|---|---|
| 1980s | 2.80 → 4.75 | ❌ -69% yuan depreciation | Currency liberalization, dual rates |
| 1990s | 4.75 → 8.28 | ❌ -74% yuan depreciation | Pegging policy, fixed USD anchor |
| 2000s | 8.28 → 6.83 | 🟢 +21% yuan appreciation | Managed float begins (2005), WTO accession |
| 2010s | 6.83 → 6.95 | ⚠️ Flat trend | Trade war, capital controls, minor rebound |
| 2020s (till 2025) | 6.95 → 7.20 | ❌ -3.6% yuan depreciation | Pandemic, Fed hikes, China policy easing |
USD/CNY - US Dollar / Chinese Yuan Currency Rate
Live Price of USD/CNY. USD/CNY Live Chart, Intraday & Historical Live Chart, Buy Sell Signal, USD/CNY News, USD/CNY Averages, Returns & Historical Data
» USD/CNY
» USD/CNY Real Time Quotes
» USD/CNY Live Chart
» USD/CNY Intraday Chart
» USD/CNY Historical Chart
» USD/CNY Buy Sell Signal
» USD/CNY News
» USD/CNY Videos
» USD/CNY Averages
» USD/CNY Currency Pair
» USD/CNY Historical Data