| Symbol | Last | Change | % | High | Low |
|---|---|---|---|---|---|
| TOPIX – JAPAN | 2,728.53 | -0.87 | -0.03% | 2,735.51 | 2,713.42 |
| Close | Japan Time : Mon May 06 2024 03:39 | ||||
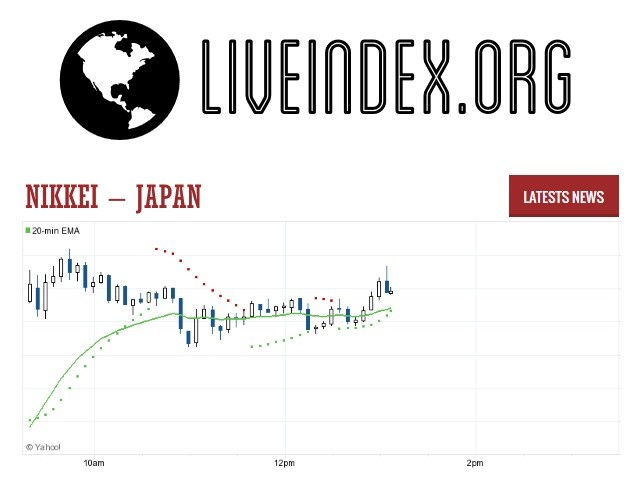
Topix : Intraday Live Chart
Topix : Technical Signal Buy & Sell
| 5 Min Signal | 1 Hour Signal | 1 Day Signal |
|---|---|---|
| Buy | Sell | Sell |
Topix : Moving Averages
| Period | MA 20 | MA 50 | MA 100 |
|---|---|---|---|
| 5 Minutes | 2730.84 | 2728.61 | 2728.61 |
| 1 Hour | 2728.32 | 2733.71 | 2712.49 |
| 1 Day | 2696.61 | 2720.72 | 2667.88 |
| 1 Week | 2596.02 | 2403.58 | 2168.37 |
Topix : Technical Resistance Level
| Resistance 1 - R1 | Resistance 2 - R2 | Resistance 3 - r3 |
|---|---|---|
| 2,738.80 | 2,751.49 | 2,760.89 |
Topix : Technical Support Level
| Support 1 - S1 | Support 2 - S2 | Support 3 - S3 |
|---|---|---|
| 2,716.71 | 2,707.31 | 2,694.62 |
Topix : Periodical High, Low & Average
| Period | High Change from Last | Low Change from Last | Average Change from Last |
|---|---|---|---|
| 1 Week | 2,747.34 -18.81 | 2,653.51 +75.02 | 2,723.93 +4.60 |
| 1 Month | 2,768.33 -39.80 | 2,598.45 +130.08 | 2,705.83 +22.70 |
| 3 Month | 2,820.45 -91.92 | 2,532.53 +196.00 | 2,691.84 +36.69 |
| 6 Month | 2,820.45 -91.92 | 2,295.51 +433.02 | 2,544.29 +184.24 |
| 1 Year | 2,820.45 -91.92 | 2,068.69 +659.84 | 2,411.91 +316.62 |
Topix : Historical Chart
Group by:


