
| Symbol | Last | Change | % | High | Low |
|---|---|---|---|---|---|
| RTSI – RUSSIA | 1,184.68 | +6.72 | +0.57% | 1,187.14 | 1,176.54 |
| Close | Russia Time : Sun May 05 2024 19:59 | ||||
RTSI : Intraday Live Chart
RTSI : Technical Signal Buy & Sell
| 5 Min Signal | 1 Hour Signal | 1 Day Signal |
|---|---|---|
| Sell | Sell | Buy |
RTSI : Moving Averages
| Period | MA 20 | MA 50 | MA 100 |
|---|---|---|---|
| 5 Minutes | 1184.68 | 1185.23 | 1183.73 |
| 1 Hour | 1183.75 | 1184.03 | 1180.57 |
| 1 Day | 1173.17 | 1152.42 | 1135.47 |
| 1 Week | 1122.98 | 1055.91 | 1058.01 |
RTSI : Technical Resistance Level
| Resistance 1 - R1 | Resistance 2 - R2 | Resistance 3 - r3 |
|---|---|---|
| 1,184.77 | 1,188.89 | 1,195.37 |
RTSI : Technical Support Level
| Support 1 - S1 | Support 2 - S2 | Support 3 - S3 |
|---|---|---|
| 1,174.17 | 1,167.69 | 1,163.57 |
RTSI : Periodical High, Low & Average
| Period | High Change from Last | Low Change from Last | Average Change from Last |
|---|---|---|---|
| 1 Week | 1,190.75 -6.07 | 1,169.87 +14.81 | 1,179.48 +5.20 |
| 1 Month | 1,190.75 -6.07 | 1,149.65 +35.03 | 1,169.26 +15.42 |
| 3 Month | 1,190.75 -6.07 | 1,062.06 +122.62 | 1,137.59 +47.09 |
| 6 Month | 1,190.75 -6.07 | 1,034.59 +150.09 | 1,119.58 +65.10 |
| 1 Year | 1,190.75 -6.07 | 0.00 +1,184.68 | 1,064.78 +119.90 |
RTSI : Historical Chart
Group by:
Related News


About RTSI – Russia 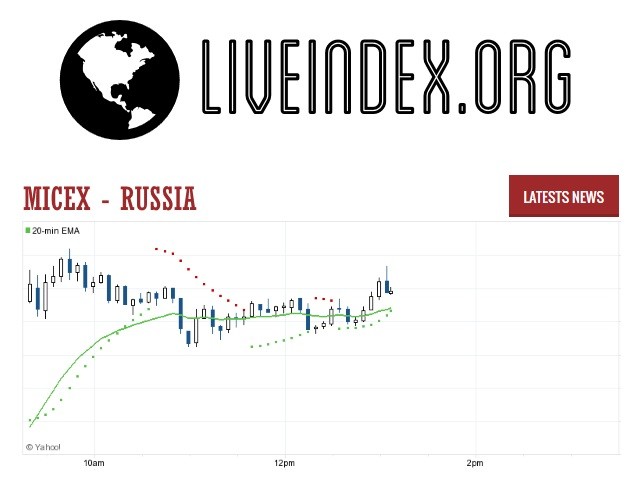
RTSI - RTSI Index | RTSI Live Quotes | Russia Index
Live Price of Rtsi. Rtsi Live Chart, Rtsi Intraday & Historical Live Chart. Rtsi Buy Sell Signal, Rtsi News, Rtsi Videos, Rtsi Averages, Returns & Historical Data
» Rtsi
» Rtsi Real Time Quotes
» Rtsi Live Chart
» Rtsi Intraday Chart
» Rtsi Historical Chart
» Rtsi Buy Sell Signal
» Rtsi News
» Rtsi Videos
» Rtsi Averages
» Rtsi Returns
» Rtsi Historical Data