| Symbol | Last | Change | % | High | Low |
|---|---|---|---|---|---|
| PX – CZECH REPUBLIC | 2,722.33 | -31.17 | -1.13% | 2,758.79 | 2,718.11 |
| Close | Czech Republic Time : Thu Feb 12 2026 02:20 | ||||
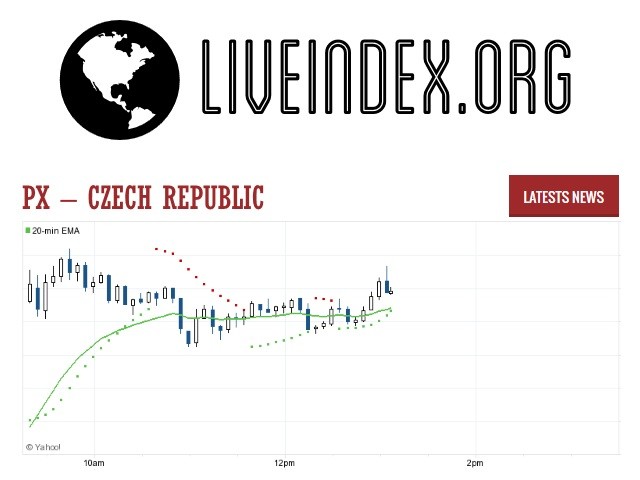
PX : Intraday Live Chart
PX : Technical Signal Buy & Sell
| 5 Min Signal | 1 Hour Signal | 1 Day Signal |
|---|---|---|
| Buy | Sell | Buy |
PX : Moving Averages
| Period | MA 20 | MA 50 | MA 100 |
|---|---|---|---|
| 5 Minutes | 2727.68 | 2727.51 | 2727.51 |
| 1 Hour | 2741.83 | 2758.56 | 2759.55 |
| 1 Day | 2745.33 | 2715.30 | 2549.21 |
| 1 Week | 2485.97 | 2246.17 | 1894.39 |
PX : Technical Resistance Level
| Resistance 1 - R1 | Resistance 2 - R2 | Resistance 3 - r3 |
|---|---|---|
| 2,768.82 | 2,794.18 | 2,809.50 |
PX : Technical Support Level
| Support 1 - S1 | Support 2 - S2 | Support 3 - S3 |
|---|---|---|
| 2,728.14 | 2,712.82 | 2,687.46 |
PX : Periodical High, Low & Average
| Period | High Change from Last | Low Change from Last | Average Change from Last |
|---|---|---|---|
| 1 Week | 2,804.96 -82.63 | 2,718.11 +4.22 | 2,757.19 -34.86 |
| 1 Month | 2,804.96 -82.63 | 2,619.29 +103.04 | 2,745.83 -23.50 |
| 3 Month | 2,804.96 -82.63 | 2,470.98 +251.35 | 2,703.08 +19.25 |
| 6 Month | 2,804.96 -82.63 | 2,253.24 +469.09 | 2,470.08 +252.25 |
| 1 Year | 2,804.96 -82.63 | 1,794.73 +927.60 | 2,272.35 +449.98 |
PX : Historical Chart
The PX Index (until March 2006 the PX 50) is an index of major stocks that trade on the Prague Stock Exchange. Selected as the starting exchange day (a benchmark date) for the Index PX 50 was 5 April 1994 and its opening value was fixed at 1,000 points. At this time the index included 50 companies traded on the Prague Stock Exchange, accordingly named PX 50.
After an initial boom encouraged by voucher privatization (the top was in February 1994 retroactively calculated on 1245 points) the index started to decline fast, and ended the year 1994 with 557 points. In 1995 the decline continued (influenced by the Mexican crisis, that discouraged foreign investors from emerging markets) and the index reached its first bottom on 29 June with 387 points. Then the index increased slowly and ended the year 1995 with 426 points. The slow increase continued in 1996 and the index reached its second top on 25 February 1997 with 629 points. In 1998 influenced by 1998 Russian financial crisis the index reached its historical bottom on 8 October with 316 points. In 1999 the index emerged back to 500 points.
With the help of the dot-com bubble and starting banks privatization, the index reached its second top on 24 March 2000 with 691 points. With the end of dot-com bubble and the IPB bank crisis, the index declined back to 500 points. In 2001, the index slightly decreased and with the help of the influence of the September 11, 2001 attacks reached bottom on 17 September with 320 points. In 2002, the index slowly increased back to 500 points. In 2003 the index was rising, and ended the year with 659 points. With the help of the Czech Republic European Union accession, the index continued rising in 2004. It reached 1000 points on 19 November and ended the year with 1032 points. The index continued rising in 2005 and ended the year with 1473 points. On 20 March 2006 the PN 50 index was merged with PX-D into the PX index. The index reached bottom on 13 June with 1167 points after legislative elections, but ended the year with 1589 points. On 29 October 2007 it reached its top with 1936 points and ended the year with 1815 points. As result of financial crisis reached 700 points on 27 October 2008, losing 50% of its value in two months, second financial crisis based bottom was reached on 18 February 2009 with 629 points.
PX - PX 50 Index | PX 50 Live Quotes | Czech Republic Index

Live Price of PX. PX Live Chart, PX Intraday & Historical Live Chart. PX Buy Sell Signal, PX News, PX Videos, PX Averages, Returns & Historical Data
» PX
» PX Real Time Quotes
» PX Live Chart
» PX Intraday Chart
» PX Historical Chart
» PX Buy Sell Signal
» PX News
» PX Videos
» PX Averages
» PX Returns
» PX Historical Data


