| Symbol | Last | Change | % | High | Low |
|---|---|---|---|---|---|
| NIFTY 50 – INDIA | 25,571.2 | +116.9 | +0.46% | 25,663.6 | 25,379.8 |
| Close | India Time : Sat Feb 21 2026 16:53 | ||||
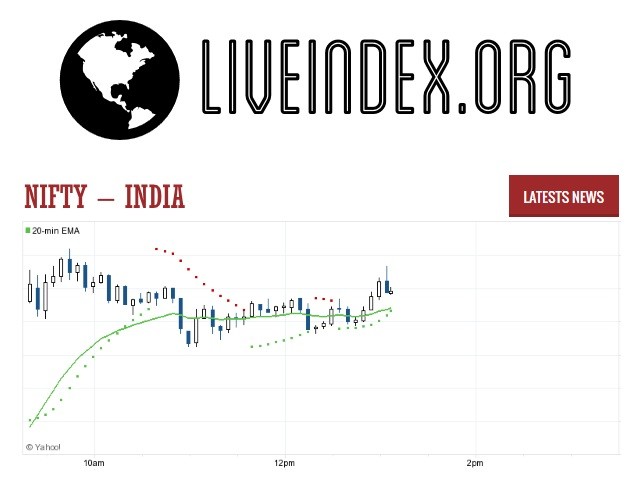
NSE Nifty : Intraday Live Chart
NSE Nifty : Technical Signal Buy & Sell
| 5 Min Signal | 1 Hour Signal | 1 Day Signal |
|---|---|---|
| Sell | Sell | Sell |
NSE Nifty : Moving Averages
| Period | MA 20 | MA 50 | MA 100 |
|---|---|---|---|
| 5 Minutes | 25571.25 | 25580.46 | 25587.44 |
| 1 Hour | 25544.45 | 25563.42 | 25649.55 |
| 1 Day | 25604.37 | 25626.96 | 25824.59 |
| 1 Week | 25720.66 | 24943.87 | 24371.41 |
NSE Nifty : Technical Resistance Level
| Resistance 1 - R1 | Resistance 2 - R2 | Resistance 3 - r3 |
|---|---|---|
| 25,586.9 | 25,690.4 | 25,870.7 |
NSE Nifty : Technical Support Level
| Support 1 - S1 | Support 2 - S2 | Support 3 - S3 |
|---|---|---|
| 25,303.1 | 25,122.8 | 25,019.3 |
NSE Nifty : Periodical High, Low & Average
| Period | High Change from Last | Low Change from Last | Average Change from Last |
|---|---|---|---|
| 1 Week | 25,873.3 -302.1 | 25,379.8 +191.4 | 25,599.3 -28.1 |
| 1 Month | 26,308.1 -736.9 | 24,685.1 +886.1 | 25,470.7 +100.5 |
| 3 Month | 26,370.5 -799.3 | 24,685.1 +886.1 | 25,811.2 -240.0 |
| 6 Month | 26,370.5 -799.3 | 24,404.7 +1,166.5 | 25,541.7 +29.5 |
| 1 Year | 26,370.5 -799.3 | 21,758.4 +3,812.8 | 24,804.2 +767.0 |
NSE Nifty : Historical Chart
The CNX Nifty, also called the Nifty 50 or simply the Nifty, is a stock market index and benchmark index for Indian equity market. Nifty is owned and managed by India Index Services and Products Ltd. (IISL), which is a joint venture between NSE and CRISIL (Credit Rating and Information Services of India Ltd). IISL is India’s first specialized company focused upon the index as a core product. IISL has a marketing and licensing agreement with Standard & Poor’s for co-branding equity indices. ‘CNX’ in its name stands for ‘CRISIL NSE Index’.
CNX Nifty has shaped up as the largest single financial product in India, with an ecosystem comprising: exchange traded funds (onshore and offshore), exchange-traded futures and options (at NSE in India and at SGX and CME abroad), other index funds and OTC derivatives (mostly offshore).
The CNX Nifty covers 22 sectors of the Indian economy and offers investment managers exposure to the Indian market in one portfolio. The CNX Nifty stocks represents about 67.27% of the free float market capitalization of the stocks listed at National Stock Exchange (NSE) as on September 30, 2012.
The CNX Nifty index is a free float market capitalisation weighted index. The index was initially calculated on full market capitalisation methodology. From June 26, 2009, the computation was changed to free float methodology. The base period for the CNX Nifty index is November 3, 1995, which marked the completion of one year of operations of NSE’s Capital Market Segment. The base value of the index has been set at 1000, and a base capital of Rs 2.06 trillion. The CNX Nifty Index was developed by Ajay Shah and Susan Thomas. The CNX Nifty currently consists of the following 50 major Indian companies
Nifty - Nifty 50 Index | Nifty 50 Live Quotes | India Index

Live Price of Nifty. Nifty Live Chart, Nifty Intraday & Historical Live Chart. Nifty Buy Sell Signal, Nifty News, Nifty Videos, Nifty Averages, Returns & Historical Data
» Nifty
» Nifty Real Time Quotes
» Nifty Live Chart
» Nifty Intraday Chart
» Nifty Historical Chart
» Nifty Buy Sell Signal
» Nifty News
» Nifty Videos
» Nifty Averages
» Nifty Returns
» Nifty Historical Data


