
| Symbol | Last | Change | % | High | Low |
|---|---|---|---|---|---|
| KOSPI – KOREA | 5,808.62 | -50.25 | -0.86% | 5,827.73 | 5,730.23 |
| Close | South Korea Time : Tue Apr 14 2026 02:11 | ||||
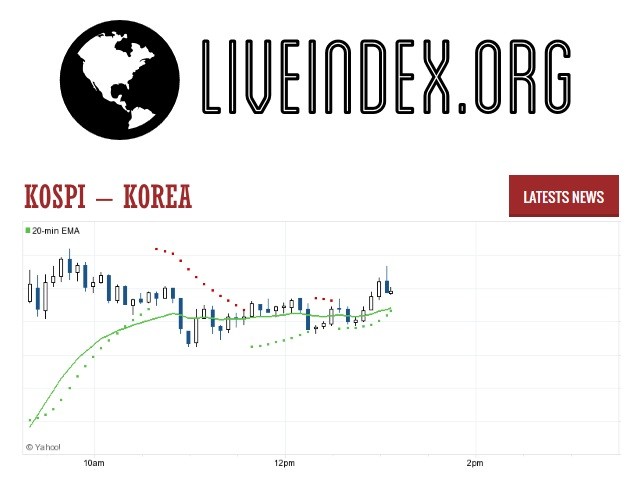
Kospi : Intraday Live Chart
Kospi : Technical Signal Buy & Sell
| 5 Min Signal | 1 Hour Signal | 1 Day Signal |
|---|---|---|
| Neutral | Sell | Sell |
Kospi : Moving Averages
| Period | MA 20 | MA 50 | MA 100 |
|---|---|---|---|
| 5 Minutes | 5808.62 | 5808.62 | 5808.62 |
| 1 Hour | 5821.20 | 5846.70 | 5840.90 |
| 1 Day | 5510.73 | 5652.03 | 5214.20 |
| 1 Week | 4895.62 | 3899.96 | 3231.36 |
Kospi : Technical Resistance Level
| Resistance 1 - R1 | Resistance 2 - R2 | Resistance 3 - r3 |
|---|---|---|
| 1,952.96 | 0.00 | 1,952.96 |
Kospi : Technical Support Level
| Support 1 - S1 | Support 2 - S2 | Support 3 - S3 |
|---|---|---|
| 1,952.96 | 0.00 | 1,952.96 |
Kospi : Periodical High, Low & Average
| Period | High Change from Last | Low Change from Last | Average Change from Last |
|---|---|---|---|
| 1 Week | 5,918.59 -109.97 | 5,404.91 +403.71 | 5,738.87 +69.75 |
| 1 Month | 5,931.03 -122.41 | 5,043.60 +765.02 | 5,549.18 +259.44 |
| 3 Month | 6,347.41 -538.79 | 4,624.79 +1,183.83 | 5,367.55 +441.07 |
| 6 Month | 6,347.41 -538.79 | 3,537.00 +2,271.62 | 4,690.04 +1,118.58 |
| 1 Year | 6,347.41 -538.79 | 2,395.40 +3,413.22 | 3,844.47 +1,964.15 |
Kospi : Historical Chart
Related News


The Korea Composite Stock Price Index or KOSPI was launched in 1983 with the base value of 100 as of January 4, 1980. KOSPI is the major stock market index of South Korea. The index represents all common stocks traded on the Korea Exchange. The index calculation is based on market capitalization method. KOSPI replaced Dow-style KCSPI (Korea Composite Stock Price Index) in 1983.
KOSPI moved below 1,000 mark for several years. The index breached 1,000 for the first time in April 1989. KOSPI recorded its largest one-day percentage gain of 8.50% on June 17, 1998 & largest one-day percentage drop of 12.02% on September 12, 2001. The index’s Korean name was officially changed to Koseupi jisu in November 2005. KOSPI reached another milestone of breaking 2000 level for the first time on July 24, 2007.
Kospi - Kospi Composite Index | Kospi Live Quotes | Korea Index
Live Price of Kospi. Kospi Live Chart, Kospi Intraday & Historical Live Chart. Kospi Buy Sell Signal, Kospi News, Kospi Videos, Kospi Averages, Returns & Historical Data
» Kospi
» Kospi Real Time Quotes
» Kospi Live Chart
» Kospi Intraday Chart
» Kospi Historical Chart
» Kospi Buy Sell Signal
» Kospi News
» Kospi Videos
» Kospi Averages
» Kospi Returns
» Kospi Historical Data