
| Symbol | Last | Change | % | High | Low |
|---|---|---|---|---|---|
| DJ NZ – NEW ZEALAND | 306.63 | -5.43 | -1.74% | 307.25 | 305.16 |
| Close | New Zealand Time : Mon Apr 13 2026 17:05 | ||||
DJ NZ : Intraday Live Chart
DJ NZ : Technical Signal Buy & Sell
| 5 Min Signal | 1 Hour Signal | 1 Day Signal |
|---|---|---|
| Buy | Sell | Sell |
DJ NZ : Moving Averages
| Period | MA 20 | MA 50 | MA 100 |
|---|---|---|---|
| 5 Minutes | 306.23 | 306.22 | 306.22 |
| 1 Hour | 310.05 | 311.22 | 312.11 |
| 1 Day | 314.74 | 317.72 | 327.73 |
| 1 Week | 337.05 | 350.28 | 346.87 |
DJ NZ : Technical Resistance Level
| Resistance 1 - R1 | Resistance 2 - R2 | Resistance 3 - r3 |
|---|---|---|
| 314.33 | 316.08 | 318.35 |
DJ NZ : Technical Support Level
| Support 1 - S1 | Support 2 - S2 | Support 3 - S3 |
|---|---|---|
| 310.31 | 308.04 | 306.29 |
DJ NZ : Periodical High, Low & Average
| Period | High Change from Last | Low Change from Last | Average Change from Last |
|---|---|---|---|
| 1 Week | 317.81 -11.18 | 310.04 -3.41 | 313.03 -6.40 |
| 1 Month | 318.69 -12.06 | 307.02 -0.39 | 312.93 -6.30 |
| 3 Month | 338.27 -31.64 | 307.02 -0.39 | 320.75 -14.12 |
| 6 Month | 363.39 -56.76 | 307.02 -0.39 | 333.75 -27.12 |
| 1 Year | 373.48 -66.85 | 307.02 -0.39 | 350.72 -44.09 |
DJ NZ : Historical Chart
Group by:
Related News


About DJ NZ – New Zealand 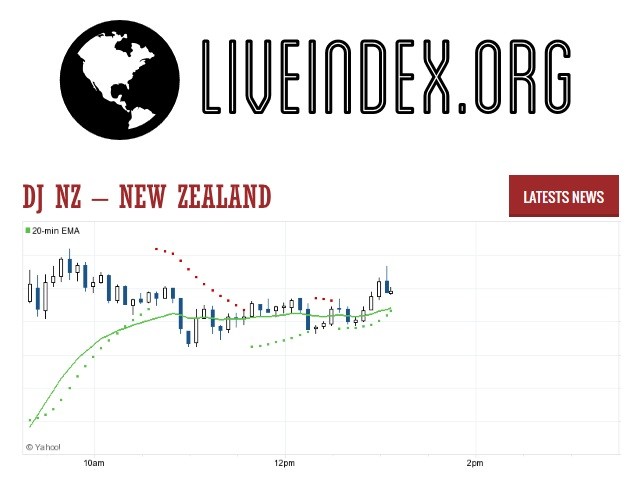
DJ NZ - DJ NZ 50 Index | DJ New Zealand Live Quotes | New Zealand Index
Live Price of DJ NZ. DJ NZ Live Chart, DJ NZ Intraday & Historical Live Chart. DJ NZ Buy Sell Signal, DJ NZ News, DJ NZ Videos, DJ NZ Averages, Returns & Historical Data
» DJ NZ
» DJ NZ Real Time Quotes
» DJ NZ Live Chart
» DJ NZ Intraday Chart
» DJ NZ Historical Chart
» DJ NZ Buy Sell Signal
» DJ NZ News
» DJ NZ Videos
» DJ NZ Averages
» DJ NZ Returns
» DJ NZ Historical Data