
| Symbol | Last | Change | % | High | Low |
|---|---|---|---|---|---|
| BRENT CRUDE OIL | 101.62 | +6.42 | +6.74% | 103.87 | 100.94 |
| Open Last Trade : 07:26 | GMT Time : Mon Apr 13 2026 07:26 | ||||
Brent Oil : Intraday Live Chart
Brent Oil : Technical Signal Buy & Sell
| 5 Min Signal | 1 Hour Signal | 1 Day Signal |
|---|---|---|
| Sell | Buy | Buy |
Brent Oil : Moving Averages
| Period | MA 20 | MA 50 | MA 100 |
|---|---|---|---|
| 5 Minutes | 101.76 | 102.01 | 102.25 |
| 1 Hour | 98.23 | 96.45 | 96.45 |
| 1 Day | 106.20 | 94.84 | 80.33 |
| 1 Week | 76.15 | 70.63 | 73.50 |
Brent Oil : Technical Resistance Level
| Resistance 1 - R1 | Resistance 2 - R2 | Resistance 3 - r3 |
|---|---|---|
| 102.89 | 103.87 | 105.82 |
Brent Oil : Technical Support Level
| Support 1 - S1 | Support 2 - S2 | Support 3 - S3 |
|---|---|---|
| 99.96 | 98.01 | 97.03 |
Brent Oil : Periodical High, Low & Average
| Period | High Change from Last | Low Change from Last | Average Change from Last |
|---|---|---|---|
| 1 Week | 111.77 -10.15 | 94.39 +7.23 | 100.50 +1.12 |
| 1 Month | 119.24 -17.62 | 94.39 +7.23 | 106.16 -4.54 |
| 3 Month | 119.24 -17.62 | 63.29 +38.33 | 83.31 +18.31 |
| 6 Month | 119.24 -17.62 | 58.73 +42.89 | 72.37 +29.25 |
| 1 Year | 119.24 -17.62 | 58.50 +43.12 | 69.80 +31.82 |
Brent Oil : Historical Chart
Group by:
Related News


About Brent Crude Oil 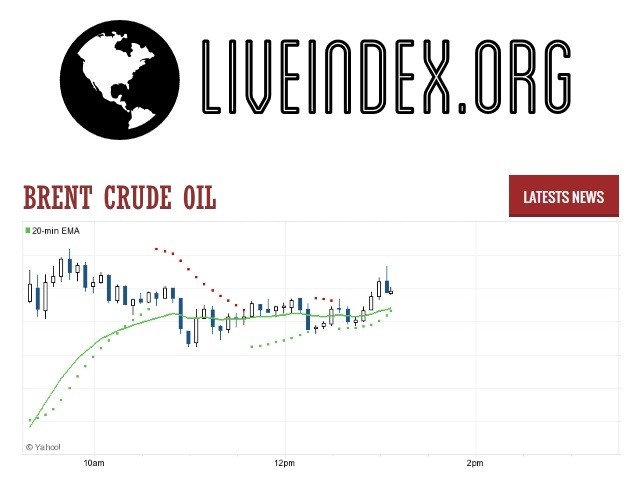
Brent Crude Oil | Brent Crude Oil Prices | Brent Crude Oil Live Quotes | Brent Crude Oil Prices in US Dollar | Brent Crude Oil Live Quotes
Live Price of Brent Crude Oil. Brent Crude Oil Live Chart, Intraday & Historical Chart. Brent Crude Oil Buy & Sell Signal and News & Videos, Brent Crude Oil Averages, Returns & Historical Data
» Brent Crude Oil
» Brent Crude Oil Real Time Quotes
» Brent Crude Oil Live Chart
» Brent Crude Oil Intraday Chart
» Brent Crude Oil Historical Chart
» Brent Crude Oil Buy Sell Signal
» Brent Crude Oil News
» Brent Crude Oil Videos
» Brent Crude Oil Averages
» Brent Crude Oil Currency Pair
» Brent Crude Oil Historical Data