| Symbol | Last | Change | % | High | Low |
|---|---|---|---|---|---|
| TOPIX – JAPAN | 3,855.28 | +71.71 | +1.90% | 3,863.90 | 3,808.45 |
| Close | Japan Time : Thu Feb 12 2026 03:56 | ||||
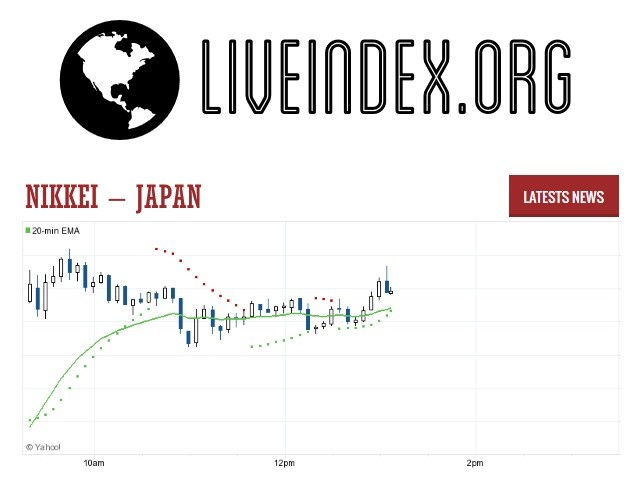
Topix : Intraday Live Chart
Topix : Technical Signal Buy & Sell
| 5 Min Signal | 1 Hour Signal | 1 Day Signal |
|---|---|---|
| Buy | Buy | Buy |
Topix : Moving Averages
| Period | MA 20 | MA 50 | MA 100 |
|---|---|---|---|
| 5 Minutes | 3854.36 | 3849.73 | 3849.73 |
| 1 Hour | 3803.12 | 3750.90 | 3713.43 |
| 1 Day | 3641.43 | 3536.77 | 3388.54 |
| 1 Week | 3322.71 | 2986.02 | 2817.14 |
Topix : Technical Resistance Level
| Resistance 1 - R1 | Resistance 2 - R2 | Resistance 3 - r3 |
|---|---|---|
| 3,828.83 | 3,839.02 | 3,884.28 |
Topix : Technical Support Level
| Support 1 - S1 | Support 2 - S2 | Support 3 - S3 |
|---|---|---|
| 3,773.38 | 3,728.12 | 3,717.93 |
Topix : Periodical High, Low & Average
| Period | High Change from Last | Low Change from Last | Average Change from Last |
|---|---|---|---|
| 1 Week | 3,863.90 -8.62 | 3,613.47 +241.81 | 3,737.85 +117.43 |
| 1 Month | 3,863.90 -8.62 | 3,488.24 +367.04 | 3,636.73 +218.55 |
| 3 Month | 3,863.90 -8.62 | 3,333.11 +522.17 | 3,530.50 +324.78 |
| 6 Month | 3,863.90 -8.62 | 3,036.87 +818.41 | 3,305.25 +550.03 |
| 1 Year | 3,863.90 -8.62 | 2,243.21 +1,612.07 | 3,000.72 +854.56 |
Topix : Historical Chart
Group by:
About Topix – Japan 
Topix - Topix 225 Index | Topix Tokyo Live Quotes | Japan Index

Live Price of Topix. Topix Live Chart, Topix Intraday & Historical Live Chart. Topix Buy Sell Signal, Topix News, Topix Videos, Topix Averages, Returns & Historical Data
» Topix
» Topix Real Time Quotes
» Topix Live Chart
» Topix Intraday Chart
» Topix Historical Chart
» Topix Buy Sell Signal
» Topix News
» Topix Videos
» Topix Averages
» Topix Returns
» Topix Historical Data


