
The price action of the Dollar Index continues to be very deceiving, as typical for trading inside a range.
From one side we have the last Quarterly bar that closed on the famous down trendline the market had broken up. This kind of closing is bearish, inviting another decline to test lower levels as 96-98 inside the previous range.
On the other side, the whole bearish setup developed after the break up was rejected by the market, as Follow through to the down side that has been made three weeks ago ended as a false break down, and a HH above the follow through Weekly bar was made on the following week (two weeks ago). But there came the passing week and showed considerable signs of weakness.
The key for understanding the market might come after one or two more days of consolidation inside the passing week’s range. If after this consolidation the market declines to test the Weekly Low and respects it while reversing up then we can follow the bullish signal to test the Monthly High (at 102.27), described in the former review. Otherwise, if after such Daily consolidation the price takes out the Weekly Low (at 99.93), then we are probably on the way down to test the Monthly Low (at 98.67).
The behavior of the price versus the open gap left at 100.5-100.71 might give some clue or justification for either side.
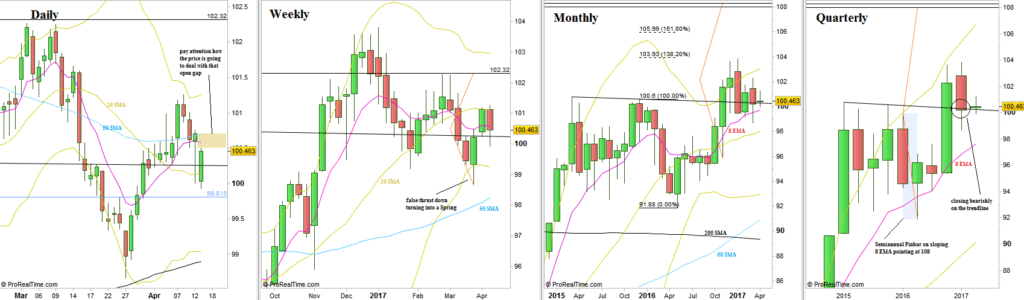
Dollar Index, various timeframes (at the courtesy of prorealtime.com)
