

The last week of March was a repetition of the previous one, ending as a HH HL bullish Pinbar on sloping 8 EMA.
The market has tested once again the open gap below, ending bullish on the Highs. The bullish signal by taking out the Weekly High was given, and the market is by most chances going to make a new all time High.
The Monthly bar of March ended bullish, penetrating the upper Bollinger band, a very important sign of strength.
The 1st Quarter of 2017 ended very strongly, a wide range Marabuzo bar.
The market is still in a Monthly bullish follow through signal to reach the 10040 level, but the Stop for this move is huge, the Monthly swing Low, below 7893.
Since the market is very stretched up, I would be cautious about maximizing the Weekly bullish Pinbar’s setup beyond the 1:1 basic target of the previous Weekly bullish Pinbar. That expected thrust up on the Weekly might be taking out the Quarterly and Monthly Highs as a bullish continuation signal, before a potential withdrawal to accumulate before most likely continuing the way up to the target at 10040. Pay attention also that the target of the current Weekly Pinbars is slightly below the 138.2% important extension of the whole Monthly correction since last September.
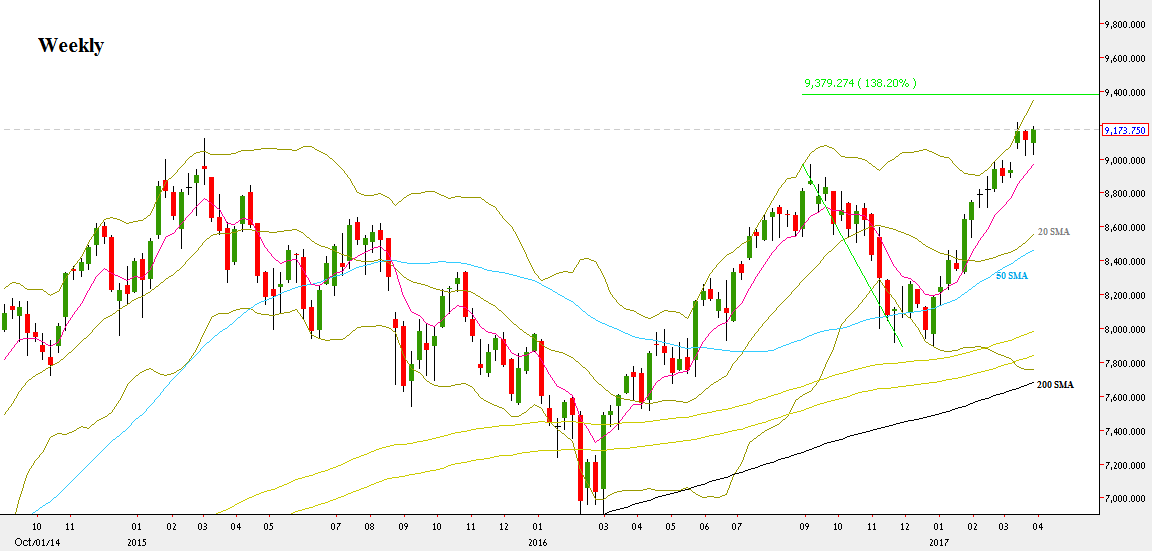
NIFTY50, Weekly chart (at the courtesy of netdania.com)
Disclaimer: Anyone who takes action by this article does it at his own risk, and the writer won’t have any liability for any damages caused by this action.


