

The passing week left a bullish pinbar on the chart, supported by the big open gap below, a gap the previous week had created.
The market is still in a Monthly bullish follow through signal to reach the 10040 level, but the Stop for this move is huge, the Monthly swing Low, below 7893.
Since the Weekly 8 EMA short term sentiment line is sloping upwards, a thrust above the Weekly High at 9167.7 is a bullish signal to reach at least the same amplitude of the passing Weekly bar.
Pay attention that the Weekly 8 EMA short term sentiment line is still way below the price, and the open gap is even wider, so there are good chances to see the coming week expand to the downside further into the open gap and the 8 EMA, where the next bullish signal might appear.
The fact that the 8 EMA is still lagging below the price raises also the possibility of a misleading move with a false Weekly thrust up ending eventually with a shakeout taking out the Weekly Low. Therefore, in case the market takes out the Weekly High (without taking out the Weekly Low first) I would have waited for another small correction and new signs of strength in order to join the move up.
Generally, as long as the gap remains open even for a tick followed by a good bullish signal, it is a good opportunity to join the uptrend.
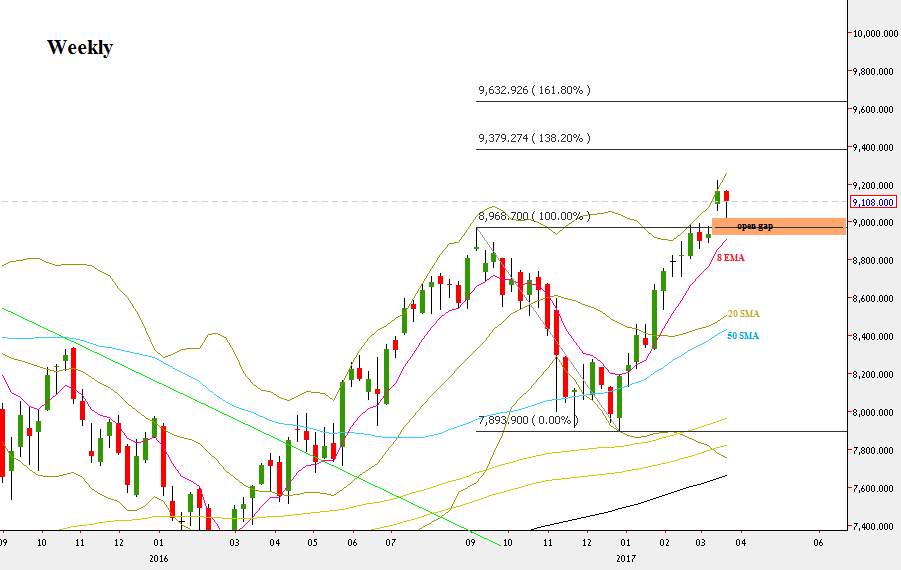
NIFTY50, Weekly chart (at the courtesy of netdania.com)
Disclaimer: Anyone who takes action by this article does it at his own risk, and the writer won’t have any liability for any damages caused by this action.


