

The passing week was mostly a sideways action, eventually printing an inside Weekly bar.
The main sign of strength is that after taking out the Monthly swing High at 8968, the market is consolidation in a relatively tiny range, on the highs.
The main sign of weakness however, is that both the Monthly and the Weekly bars are not touching their upper Bollinger band, not to mention penetrating.
A bearish setup to reach 8745 might appear on taking out the Low of the previous Friday, at 8860.3, but this wouldn’t be a good practice, as the market is biased to the bullish side. In this case (that this Low is taken out), a better practice would be to wait for another pullback up and a renewing signs of weakness.
On the other hand, taking out the inside Weekly bar’s High at 8977.85 is a bullish setup to reach 9063 level area, a new Monthly swing High, that does penetrate the Weekly upper Bollinger band.
A Monthly bullish setup to reach 10040 is still under way. The Stop is huge as well, below 7893, but taking out the Monthly Low on this very month should be an alarm that this setup is very likely to fail.
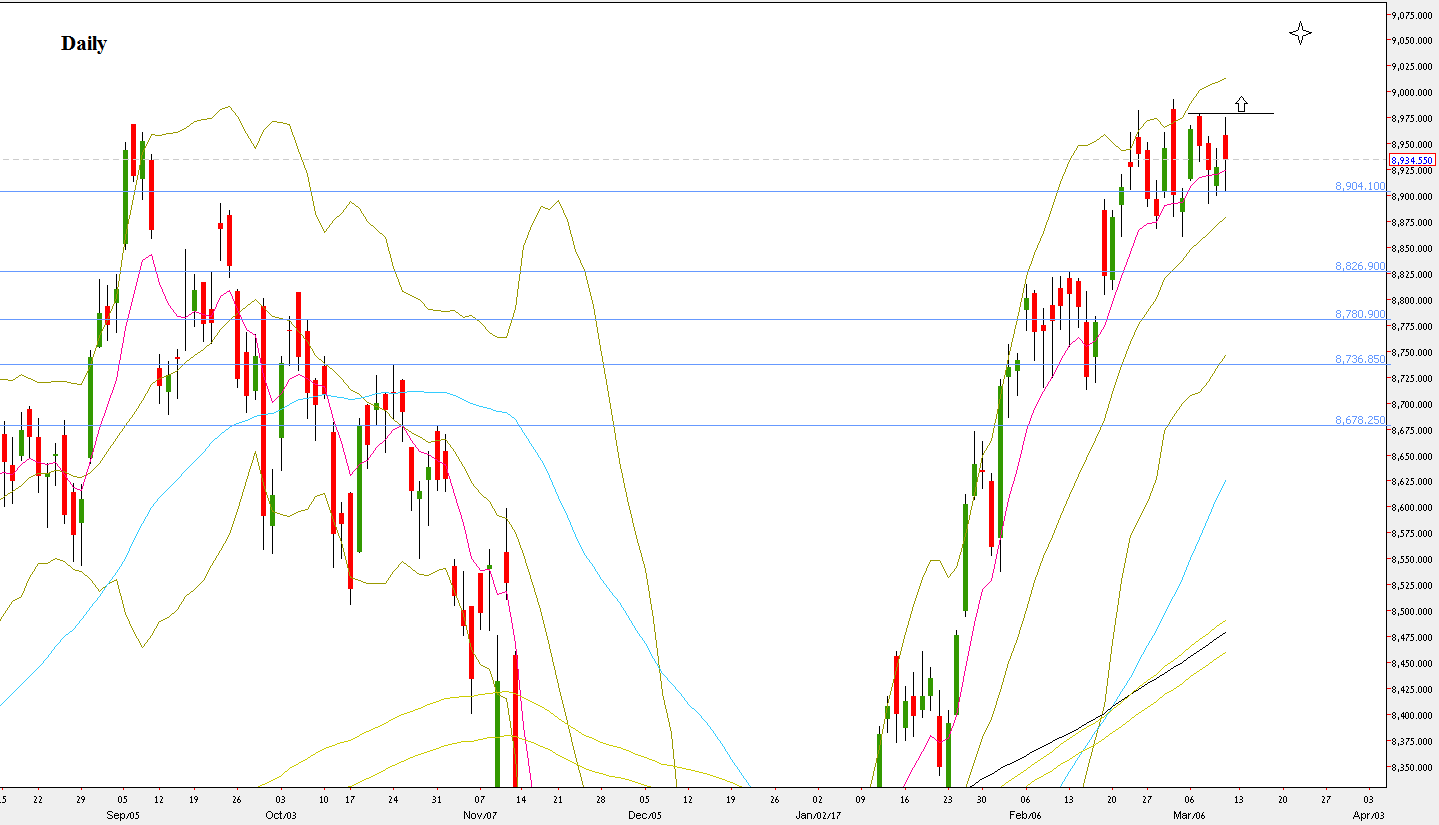
NIFTY50, Daily chart (at the courtesy of netdania.com)
Disclaimer: Anyone who takes action by this article does it at his own risk, and the writer won’t have any liability for any damages caused by this action.


