

After the big bullish Marabuzo two weeks ago, there came another consolidation week, yielding an inside Weekly bar.
Last Thursday ended as a bullish pinbar on sloping 20 SMA, but that bar closed relatively weak, below the Daily 8 EMA. Last Friday changed some of the atmosphere, but didn’t manage to close strongly. Another Daily bar like the one we had on last Friday, that closes above the 8 EMA can signal the next bullish move towards the next targets.
The market is still in a bullish setup to reach 7470, due to a bullish Weekly pinbar on sloping 8 EMA as well as the same kind of setup on the Semiannual – the first half of 2016 ended as a bullish Semiannual pinbar on sloping 8 EMA pointing approximately at the same target, 7500.
Higher target is the Quarterly bullish pinbar on sloping 8 EMA of the previous quarter, pointing at the 7600 level area. this Quarterly bar encapsulates a Follow through model on the Monthly timeframe
On the other hand, taking out the inner Weekly Low at 7263.6 without taking out the all time High at 7394.6 is a clear sign of weakness that can yield a move to reach the levels around 7145.
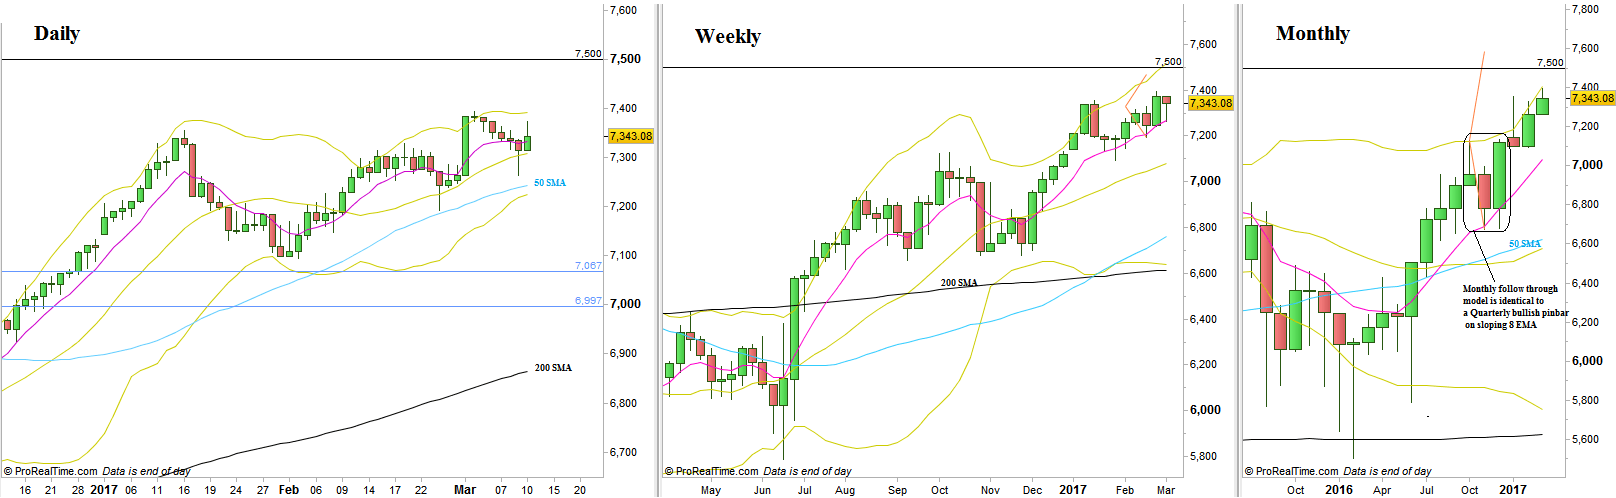
FTSE100, Daily, Weekly and Monthly timeframes (at the courtesy of prorealtime.com)
Disclaimer: Anyone who takes action by this article does it at his own risk and understanding, and the writer won’t have any liability for any damages caused by this action.


