

The passing week has brought an important indication, taking out the High of last September at 8968.7. It was a follow through to the last Monthly swing High, and the market has signaled for a long term bullish move – targeted at 10043. The Stop in this case, is huge as well, below 7894.
Looking at the Monthly chart, it is very clear to see that the whole correction that has started since March 2015, is turning into a bullish inverted Head & Shoulders pattern.
The target of 10043 is approximately at the 138.2% extension level to the whole decline that took place from March 2015 till February 2016, and might print a classical AB=CD pattern.
For better chances for this move to succeed, we should see a new all time High within the current momentum, i.e. currently it won’t be a good sign to see a monthly correction without first taking out the all time High at 9119.
Any retracement back to the 8 EMA on the Daily that ends up with a clear sign of strength like a bullish pinbar or an Engulfing pattern (the signal should be a thrust up above), can be a good bullish continuation indication, at least till the current all time High. If and when the all time High is taken out, then we might expect a major correction, at least on the Weekly scale, one that should be watched carefully for new signs of strength, in order for the above mentioned Monthly scale trend, to continue.
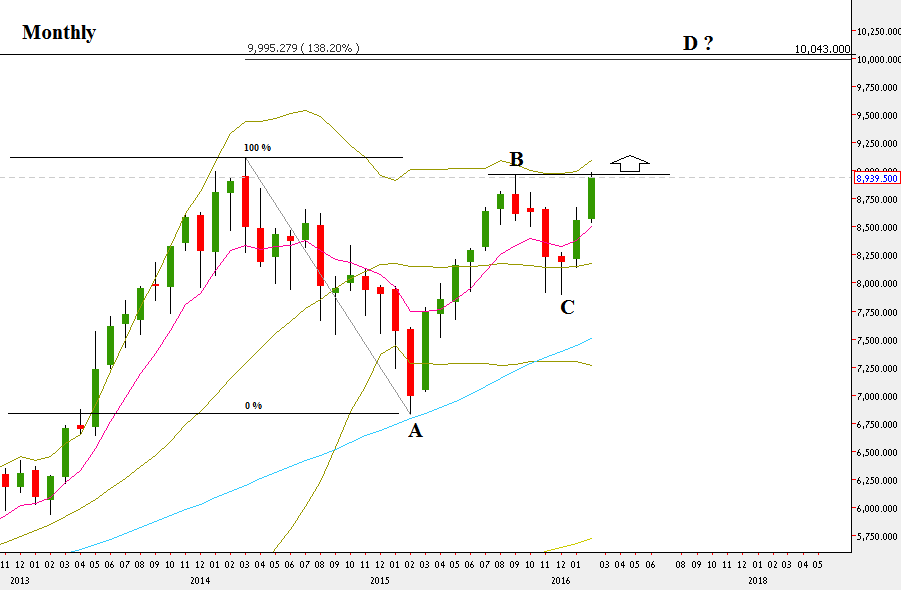
NIFTY 50, Monthly chart (at the courtesy of netdania.com)
Disclaimer: Anyone who takes action by this article does it at his own risk, and the writer won’t have any liability for any damages caused by this action.
