
A very surprising volatile week closed the year of 2016, a week in which the NIFTY was one of the strongest stock markets.
The Monthly bar has printed a LL LH bar, closing weak below the 8 EMA short term sentiment line. The Yearly bar ended as a LL LH bar, closed quite in the middle, a very random place in terms of price action predictions.
In the smaller scale, the price action is currently very misleading as well. As mentioned in the last review, taking out the Monthly Low at 7916.45 is a bearish signal towards the 7600 level area. However, the market has rallied almost immediately, to end the week very bullishly. This is another example of what might happen in case there are signs of strength prior to the bearish signal, as mentioned in that same review.
Pay attention that although the whole week looks very bullish, and in fact draws an engulfing pattern, it closed below the Weekly 8 EMA, a sign of weakness.
The most important level to focus on currently is the open gap (8230.65-8261.75). Penetrating this gap without closing it by reversing down, can be a very good opportunity to join the bearish setup. Remember though the open gap down at 7748.85 till 7809.3, and for a considerable pullback in case the market does approach this area.
On the other hand, taking out the Monthly High at 8274.8 terminates this bearish setup, and should lead to testing the High of the month of November.
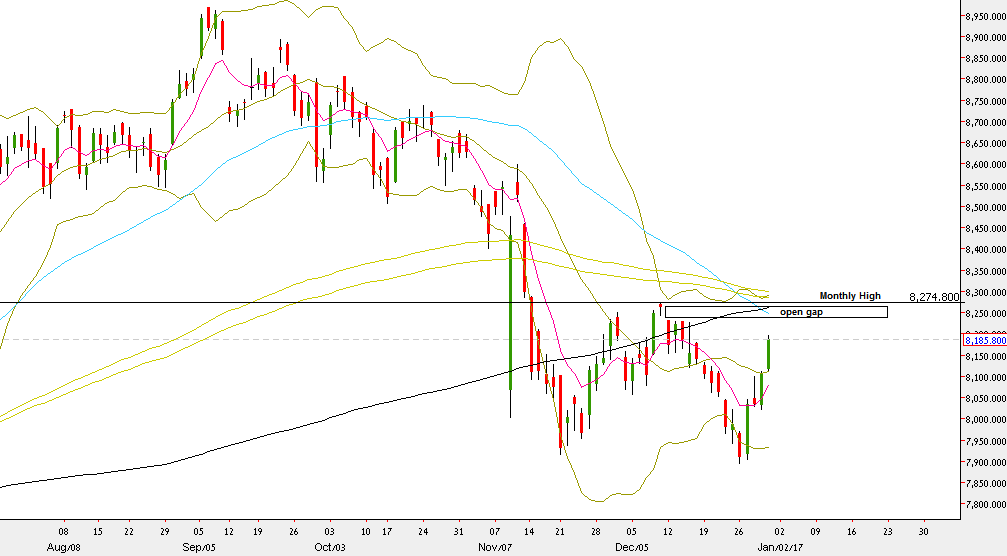
NIFTY50 – Daily chart (at the courtesy of netdania.com)


