

The NIFTY was one of the weakest stock markets throughout the passing week. The price action throughout the week was pretty bearish resulted in testing the lower edge of the current Weekly range.
The fact that the Weekly bar hasn’t touched the lower Bollinger band, and that the Daily momentum down was halted last Friday by a relatively big range Daily bar that closed finally on the middle bullishly, – both are clear signs of strength. In this case, if you look for bullish opportunity, it shouldn’t come before a Daily bounce up, followed by another decline to test the lows –but without touching the lower Daily Bollinger band, then a follow through up right after can approve a Daily reversal up. The most important resistance levels around are the 8056.9 and 8078.25 levels, as well as the Weekly 50 SMA currently at 8108. The open gap at 8046.5 till 8061.3 should also be paid attention to.
On the other hand, taking out the Monthly Low at 7916.45 is a bearish signal to reach the 7600 level area. In this case any swing idea down should refer to the open gap at 7748.85 till 7809.3.
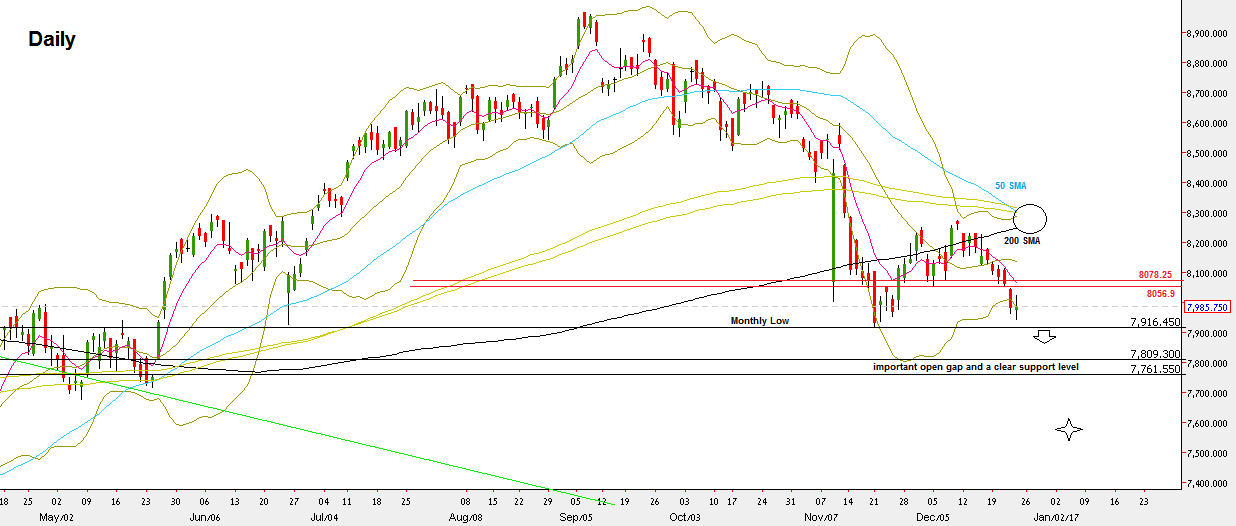
NIFTY50 – Daily chart (at the courtesy of netdania.com)
Disclaimer: Anyone who takes action by this article does it at his own risk, and the writer won’t have any liability for any damages caused by this action.


