

The passing week ended as a bullish Weekly pinbar on sloping 8 EMA, and as mentioned in the last review, a thrust up above its High is a bullish signal to reach its magnitude distance, at 104.1, a move assumed to be already under way.
This target at 104.1 is slightly below the 138.2% extension level to the whole decline made during the last year, at 104.19 and the Quarterly upper Bollinger band at 104.25.
On the Daily timeframe, pay attention to the open gap created last Thursday (levels 101.77 till 102.16). A false thrust down that doesn’t close this gap entirely can turn easily into a good bullish opportunity to reach the target at 104.1.
Above that target, the next major target is the previous Semiannual bullish pinbar on sloping 8 EMA pointing towards 108, slightly below the target of the Bullish Monthly bar of last November on sloping 8 EMA pointing at 108.3.
I wouldn’t recommend holding the same position for the higher targets than 104.1, as by the Yearly charts there are very good chances to see a considerable retracement below the stop level of that Weekly bullish pinbar, before the bigger move most likely is going to continue.
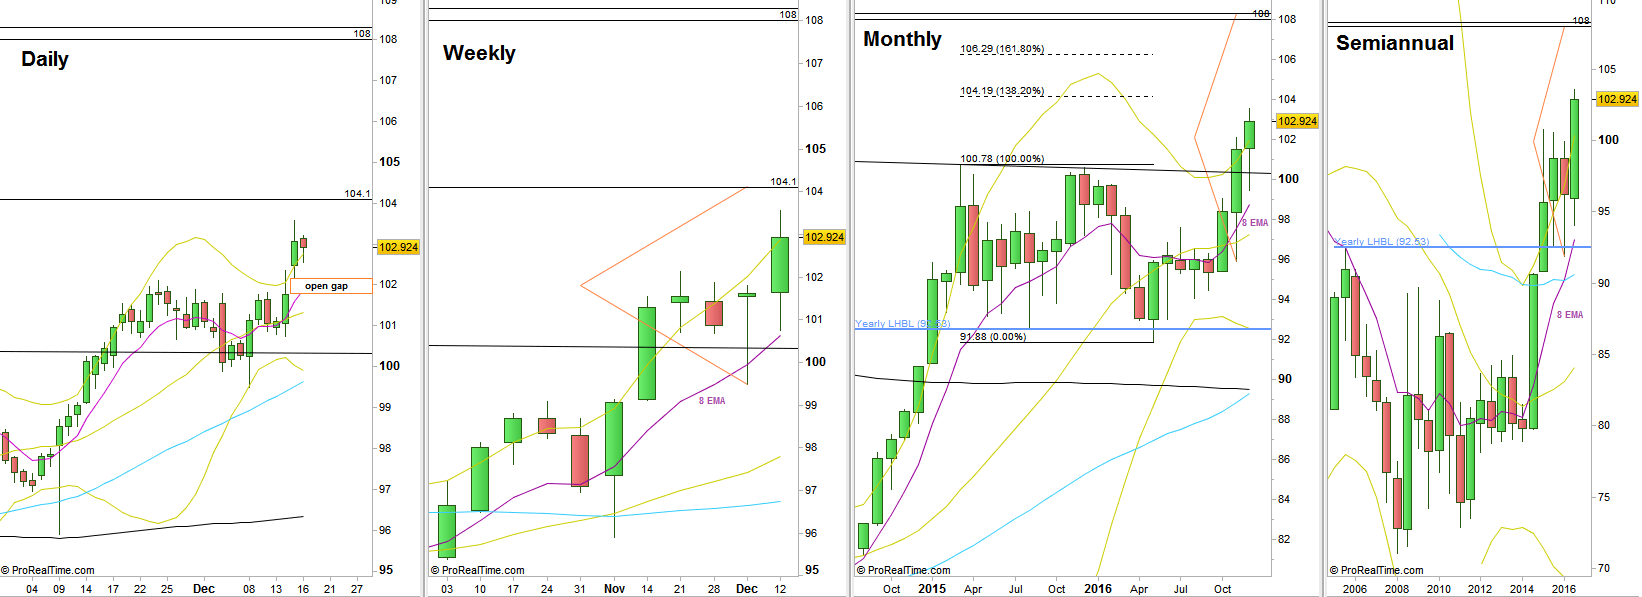
Dollar Index, Daily, Weekly, Monthly and Semiannual charts (at the courtesy of prorealtime.com)
Disclaimer: Anyone who takes action by this article does it at his own risk and understanding, and the writer won’t have any liability for any damages caused by this action.
