

The passing week printed an inside Weekly bar, relatively with a narrow range, but still very volatile inside.
Although most of the week there was a bearish activity, some signs of strength are seen clearly. The Weekly bar didn’t manage to close below the Weekly 50 SMA, although being in an environment of sloping 8 EMA pointing down. The last Thursday and Friday’s bars respected the Daily 20 SMA line lying below, and the open gap above 8102.05 as well.
A good bullish opportunity might come from having a false thrust down that takes out the Low of Wednesday December 7th at 8078.25, but respects the Weekly Low at 8056.90. If the market follows it with a thrust up on the next bar, it can trigger a bullish wave that can reach the Weekly 20 SMA, at 8500 approximately. In this case, refer to the open gap above, at 8288.55-8296.3.
On the other hand, if the Weekly Low at 8056.9 is taken out, it means that at best the we are going to spend some time staying in the current Weekly range. Taking out the Monthly Low at 7916.45 is bearish and should most likely lead to a bearish wave towards 7650. In this case, have in mind that 7670 till 7800 is a strong support area, mainly because of a considerable open gap left there 7748.85 till 7809.3.
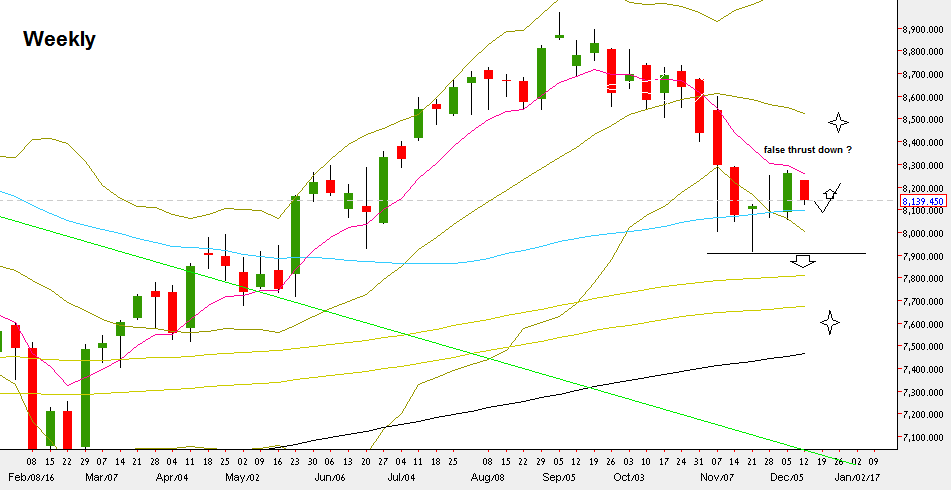
NIFTY50 : Weekly chart (at the courtesy of netdania.com)
Disclaimer: Anyone who takes action by this article does it at his own risk, and the writer won’t have any liability for any damages caused by this action.


