

A relatively volatile bullish week has passed, and the market has made quite a misleading move. First, it took out the previous Week pinbar’s Low, then jumped to close the open gap above, didn’t close it completely, followed by two bearish bars that didn’t show enough weakness to continue the move down, and the gap up on Thursday’s morning could signal to cover immediately all short swings, although there is still a remaining open gap above, causing the price to climb higher fast.
We are still in a Weekly bullish signal of the bullish pinbar three weeks ago, target at 8330 where the Monthly 8 EMA is lying currently, slightly above a current Daily signal of the rejection of the thrust down pointing at level 8302, where the Daily upper Bollinger band currently is.
A longer term bullish signal on the Daily timeframe – one reaction leg outside the lower Bollinger band, and the next reaction leg is inside the bands – points towards 8440, above the Daily 50 SMA. The target is near a clear resistance level with an open gap (8460.6-8525.75)
There is an important open gap above, levels 8288.55-8296.3 that should be taken into account on any bullish swing position.
A daily bearish pinbar, especially not closing this gap followed by a thrust down the next day is a clear sign of weakness that can cause the price to decline back into the mid Daily range, to the levels of the open gap of last Thursday.
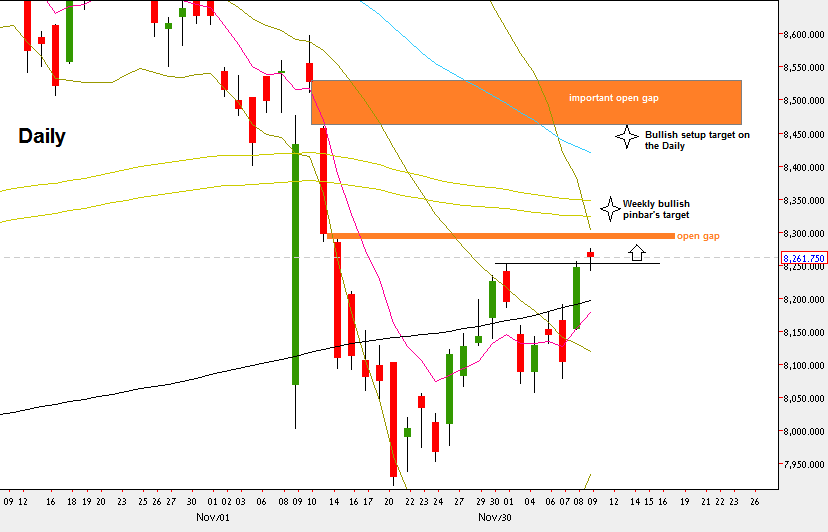
NIFTY50, Daily chart (at the courtesy of netdania.com)
Disclaimer: Anyone who takes action by this article does it at his own risk, and the writer won’t have any liability for any damages caused by this action.


