

The bearish momentum has continued last Monday, taking out the Weekly Low at 8002.25, but the market has shown a considerable recovery up for the rest of the passing week.
The whole Weekly bar turned into a false thrust down, as it closed as a bullish pinbar above the important Weekly 50 SMA. In such case, a thrust up above the Weekly High is a good bullish signal for 1:1 Weekly bar magnitude target, closed to the most important resistance above, near the 8400 level.
Currently I wouldn’t trust on such a bullish signal for more than 1:1 target, and by the Monthly price action there are much more chances in the midterm to see lower levels like 7660 being reached before a serious reversal attempt upward is made.
The current Daily bullish signal (made by the penetration of the lower Bollinger band followed by signs of strength, and a later weak follow through down) points to the area of 8155 where the Daily 200 SMA is currently lying.
For smaller stops than the whole Weekly bar’s range, I would wait for the Daily signal to reach the target, to correct down, and to rejoin the bullish momentum once new signs of strength are proven.
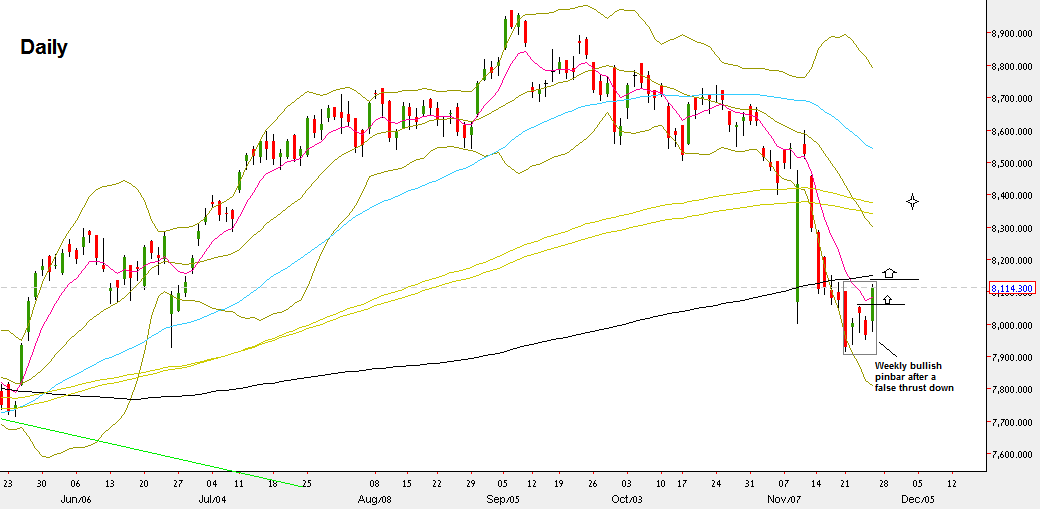
NIFTY50, Daily chart (at the courtesy of nedania.com)
Disclaimer: Anyone who takes action by this article does it at his own risk, and the writer won’t have any liability for any damages caused by this action.
