

The passing week took out the Monthly swing High at 2191.50, which had been the all time High so far, printing a bullish Weekly bar that closed on its High, penetrating the upper (Weekly) Bollinger band, very strong.
Taking out the Monthly swing High triggered an important bullish signal to reach the 2350 area, slightly above the 161.8% extension of the last Yearly major correction, considered here on previous reviews to be a major Elliott wave 4 (see chart).
The next important resistance is the level of 2222, the target of the previous week’s bullish pinbar on a sloping 8 EMA to the upside, slightly above the target of a similar Daily signal of last Wednesday.
Let have a look on the wider picture. As mentioned in the previous review, it is very interesting to see that for each important timeframe, from the Daily up to the Semiannual, all have at least one bullish signal by the form of bullish pinbar on a sloping 8 EMA or in the form of a false thrust down on the lower Bollinger band, with a considerable far target to the upside – all signals have already gotten the bullish trigger by taking out their highs. However, beware of the correct wide stop level for each signal (1:1).
By the table above, you can notice that most signals share common targets. More than that, since these are also targets of high timeframe signals, there are good chances for the whole bullish market to end by achieving most of these targets.
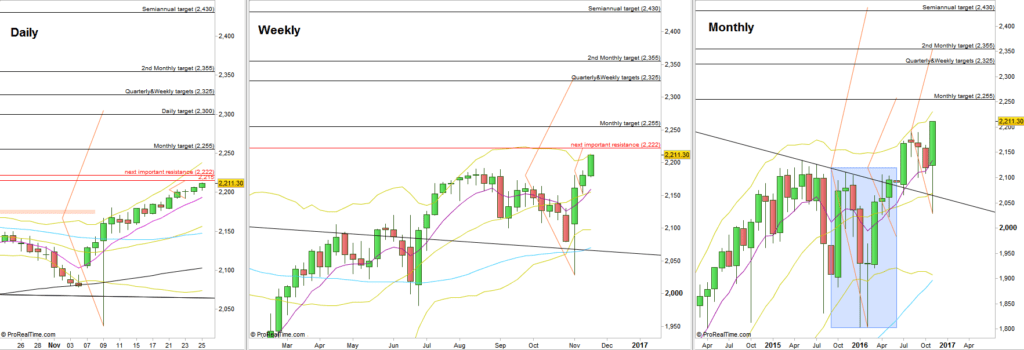
S&P Futures, Daily, Weekly and Monthly timeframes (at the courtesy of prorealtime.com)
Disclaimer: Anyone who takes action by this article does it at his own risk and understanding, and the writer won’t have any liability for any damages caused by this action.


