

The clear weakness of the Nifty has continued throughout the passing week.
Each Daily bar touched if not deeply penetrated the lower Bollinger band, and each bar didn’t miss closing below the Daily 200 SMA, a true sign of weakness. Pay attention that the Weekly bar closed slightly above the Weekly 50 SMA. These contradictions and the general Weekly price action raise the probability of having some sideways action inside the election’s week range in the near term (with a possible false break down).
The most important point around is the Low made just before the Brexit bullish move, at 7927.05. Taking out this Low is a midterm indication that the chances to deal with the Monthly 50 SMA, currently at 7350, – are high.
A good Daily bearish opportunity might come from testing again the mid Weekly range approximately at 8285, ending as a bearish reversal, such as Daily bearish pinbar on the sloping 8 EMA, closing below the 200 SMA. In this case a thrust down the next day can drive the price down to test the lower Weekly range (by the same amplitude).
A good Daily bullish opportunity might come from having a bounce up with out taking the Weekly Low at 8002.25, followed by a weak bearish day (or days), whereas the next sign of strength by taking out the High made again (a follow through), is a bullish signal to reach back at least the mid Weekly range.
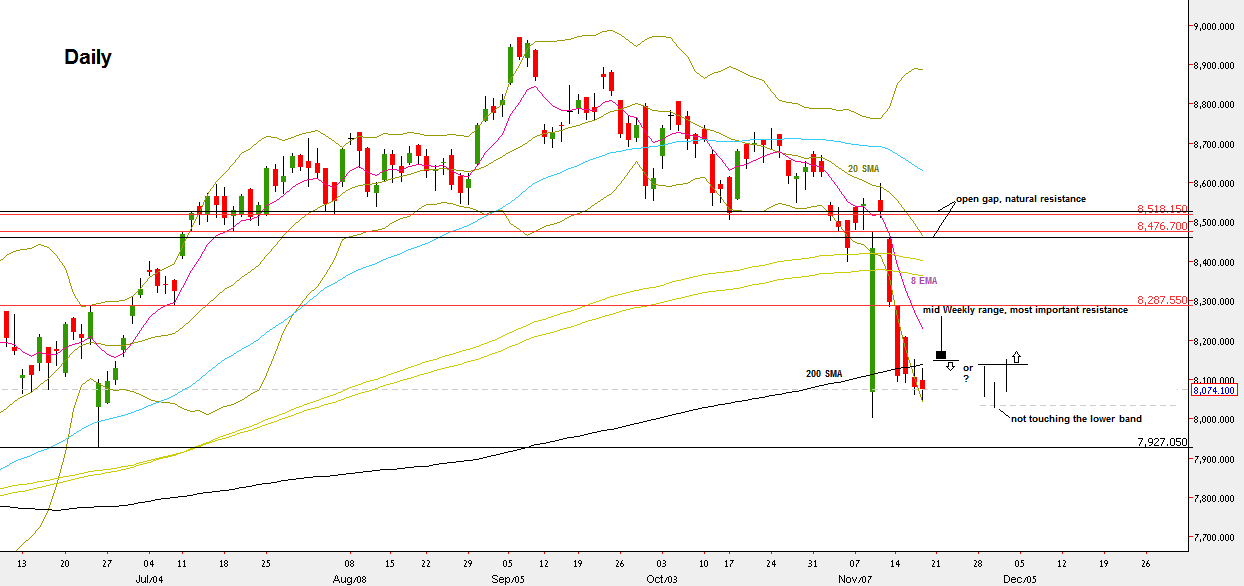
NIFTY Futures, Daily chart with possible two scenarios that were mentioned (at the courtesy of netdania.com)
Disclaimer: Anyone who takes action by this article does it at his own risk, and the writer won’t have any liability for any damages caused by this action.


