

The passing week revealed the decision of the market finally, and before the elections to go down.
As mentioned before, taking out the Low of October 17th is a bearish setup with a stop above 8736.85, currently challenging the open gap of 8323.2-8407.05, but after some support that may be revealed in the current area, this bearish signal points down towards the 8275 area, the Weekly lower Bollinger band. It is also the target of the same magnitude of the September’s Monthly bearish bar, that can be treated as a bearish Monthly pinbar that hasn’t managed to touch even the upper Bollinger band, hence weak, and has already been followed by a thrust down.
Below the above target of 8275, there is a very strong support at the open gaps: 8204-8242.1 and 8127.85-8157.65, the latter was the breakaway gap that initiated the last major bullish Daily swing. These gaps might be tested again before a new bullish move can emerge.
Currently the market is at some support, before maybe the most interesting week as of the volatility and direction. Prices can easily test the runaway gap (8549.5 -8626.25) created between last Tuesday and Wednesday, as well as continuing the decline towards the target at 8275.
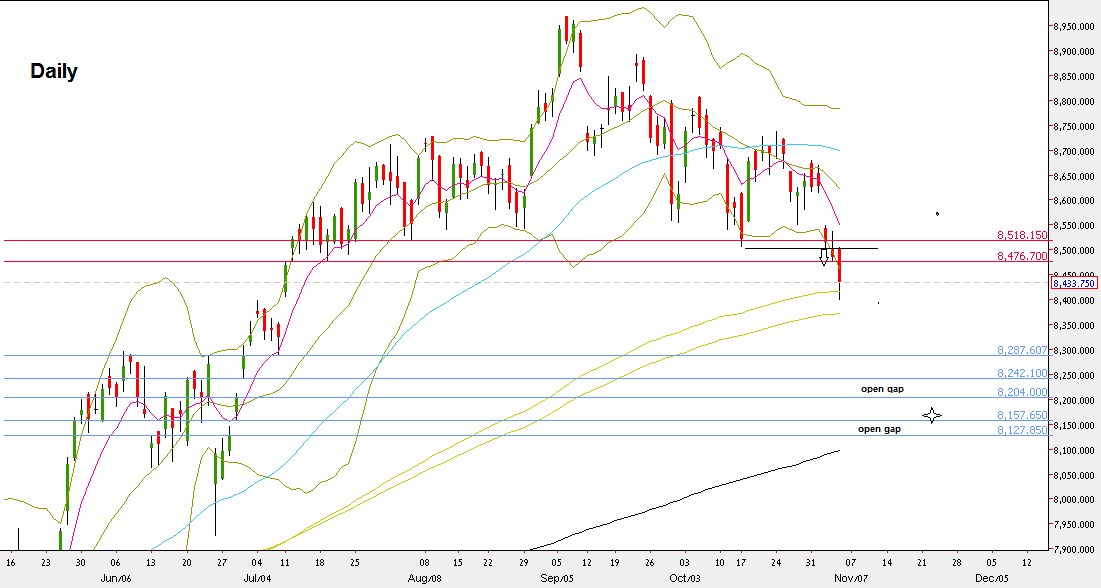
Nifty50, Daily chart (at the courtesy of prorealtime.com)
Disclaimer: Anyone who takes action by this article does it at his own risk, and the writer won’t have any liability for any damages caused by this action.


