
The Dollar Index has made a sharp reversal down over the passing week. As expected before, it took out a major swing High (98.595) on the week before, reached the semiannual upper Bollinger band and then reversed. From the Daily and above timeframe’s price action perspective, the market didn’t give any good signal to go short, at least not for the whole move done last week.
The current picture is bearish. The weekly bar closed below the 8 EMA, not a bullish sign at all, and there are pretty good chances that the prices are going to test again the Monthly midrange at 96.5.
However, we should see some pullback up before, one that ends with signs of weakness, and can give us good bearish opportunity. Notice how last Friday didn’t manage to touch not to mention close on or below the lower Bollinger band, while the Daily price action showing a clear shortening of the thrust down last Wednesday till Friday.
Currently there is no signal to go long for that expected pullback. One can emerge with a Daily bullish pinbar testing the lower Bollinger band might be a very good signal (if/when followed by a HH the next day). See the chart attached.
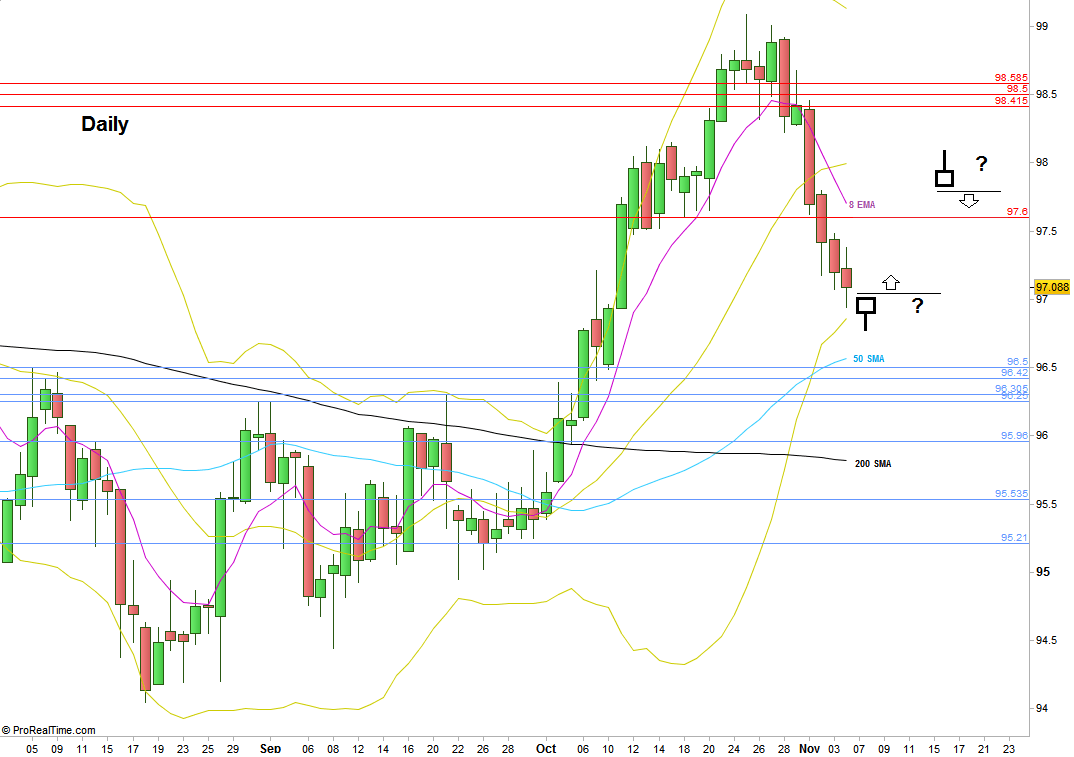
Dollar Index, Daily chart. (at the courtesy of prorealtime.com)
Disclaimer: Anyone who takes action by this article does it at his own risk and understanding, and the writer won’t have any liability for any damages caused by this action.
