

In the passing shortened trading week, the NIFTY has taken out the Low of the previous Friday, at 8663.9, and as mentioned in the previous review, it was a bearish signal.
The current Daily bearish momentum is strong, as the market didn’t recover immediately after closing the (previous) open gap, levels 8611.15-8635.15, and penetrated considerably the lower Bollinger band. The Monthly Low at 8555.35 has been taken out, but more important is taking out the LLBH (Last Low Before High) at 8543.75 before any kind of bounce like it had on last Friday, where it got some support on the Weekly 20 SMA, as expected.
As mentioned before, the real test as for the market strength is taking place currently. If the price doesn’t take out the Low at 8518.15, but respects it and reverses up, it is a clear sign of strength.
On the other hand, last Thursday and Friday formed a bearish flag with good probabilities to reach its target at 8476 and below, if the Weekly Low at 8541.7 is going to be taken out. A thrust up above the High of last Friday at 8604.15 followed by signs of weakness and triggering the bearish flag is even more reliable for the chances of this setup to work. However, beware of shorting the market on the Daily timeframe and above prior to the triggering of the bearish flag (i.e. taking out the Weekly Low).
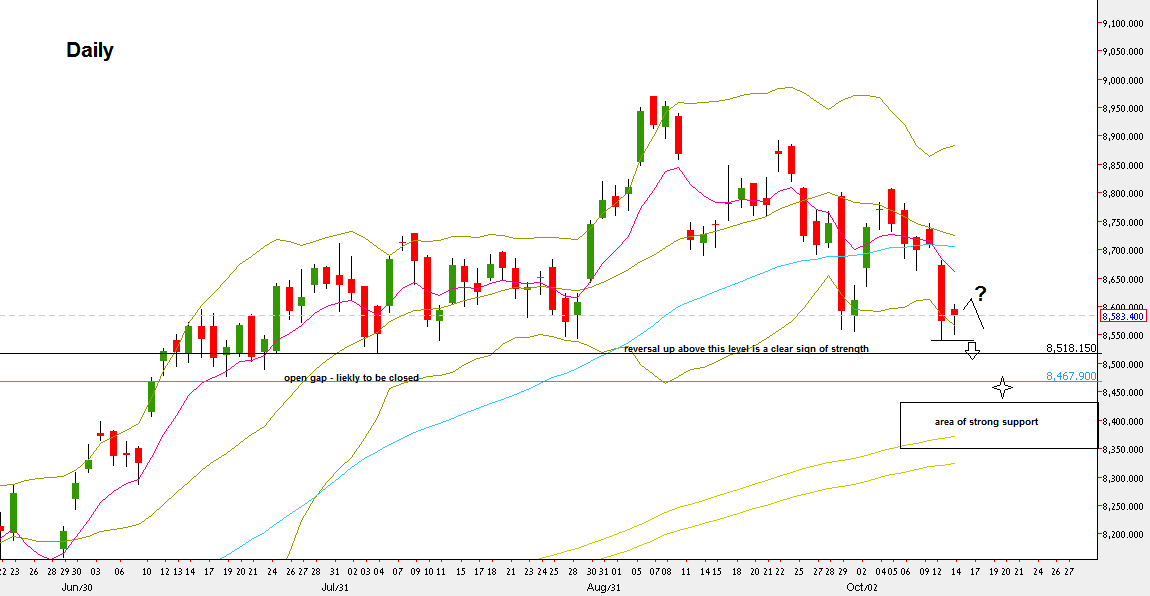
NIFTY50, Daily chart (at the courtesy of netdania.com)
Disclaimer: Anyone who takes action by this article does it at his own risk, and the writer won’t have any liability for any damages caused by this action.


