

The passing week and the close of the Month turned out to be a change of behavior. Since last February, the beginning of the current bullish wave, this has been the first week to close below the 8 EMA line, serving as the short term sentiment line.
In the last review I mentioned that the price action was not being matured for a bearish position. In that case, the Weekly inside price action has made the twist, by the upthrust made last Thursday. Taking out the low of the Daily range (Tuesday’s Low) signaled for a bearish position, and pay attention how the target – by the same amplitude 1:1 – had been achieved rapidly. In this case, another bearish signal has been triggered. Taking out the Low of 8688.90 is a signal to reach the 8520 area, but is less reliable because of being the first major bearish sign in a strong bull wave (for that timeframe).
The Monthly bar has turned into a bearish Key Reversal, and a thrust down below the Monthly Low at 8555.35 is a major sign of weakness that can lead to 1:1 target of the Monthly bar amplitude, down to the Monthly 20 SMA, the mid Bollinger bands.
In order for this to be achieved we need to see not only the Monthly Low being taken out, but the Low of 8518.15, slightly above the Weekly 20 SMA (mid Bollinger bands) -taken out as well. Any Daily reversal up that takes place below the Monthly Low but above the 8518.15 Low is an important sign of strength that won’t let the market decline very easily after.
In any case of a decline, we should see some support near the Weekly 20 SMA for a probable secondary test of the upthrust made on last Thursday.
Prior to taking out the Monthly Low (if/when), the area of 8690 where the Daily 50 SMA lies – is a very strong resistance.
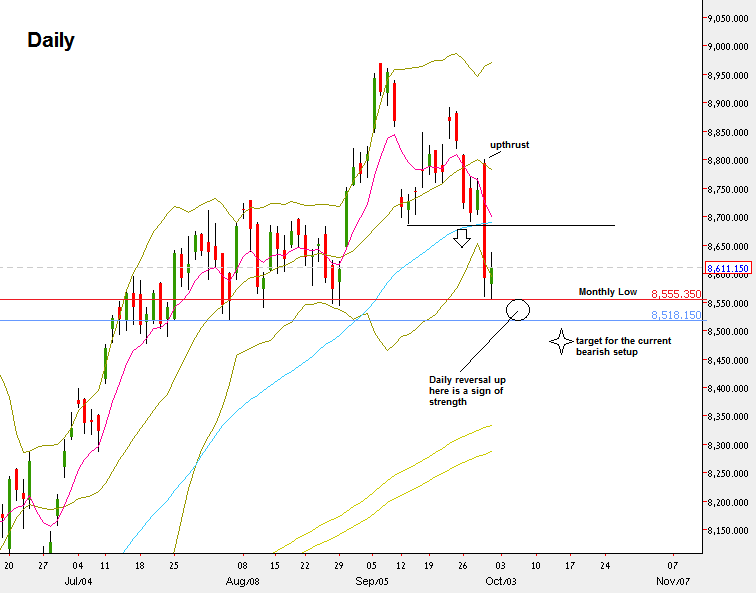
Nifty Futures, Daily chart (at the courtesy of netdania.com)
Disclaimer: Anyone who takes action by this article does it at his own risk, and the writer won’t have any liability for any damages caused by this action.


