

Not surprisingly the market has been consolidating through out the passing week, leaning on a clear support at levels 17830-17924. The price has already retraced about 50% of the post Brexit bullish wave. For the midterm (e.g. the Monthly) it is currently still bearish, unless we see rejection of the current bearish formation by a false thrust down on the right scale.
Pay attention for the midterm bearish signs:
- It has reversed down on the Monthly timeframe before touching the (Monthly) upper Bollinger band.
- The decline of last week penetrated deeply back into the range the market had tried to overcome by the post Brexit bullish wave (a break up of the whole Yearly range).
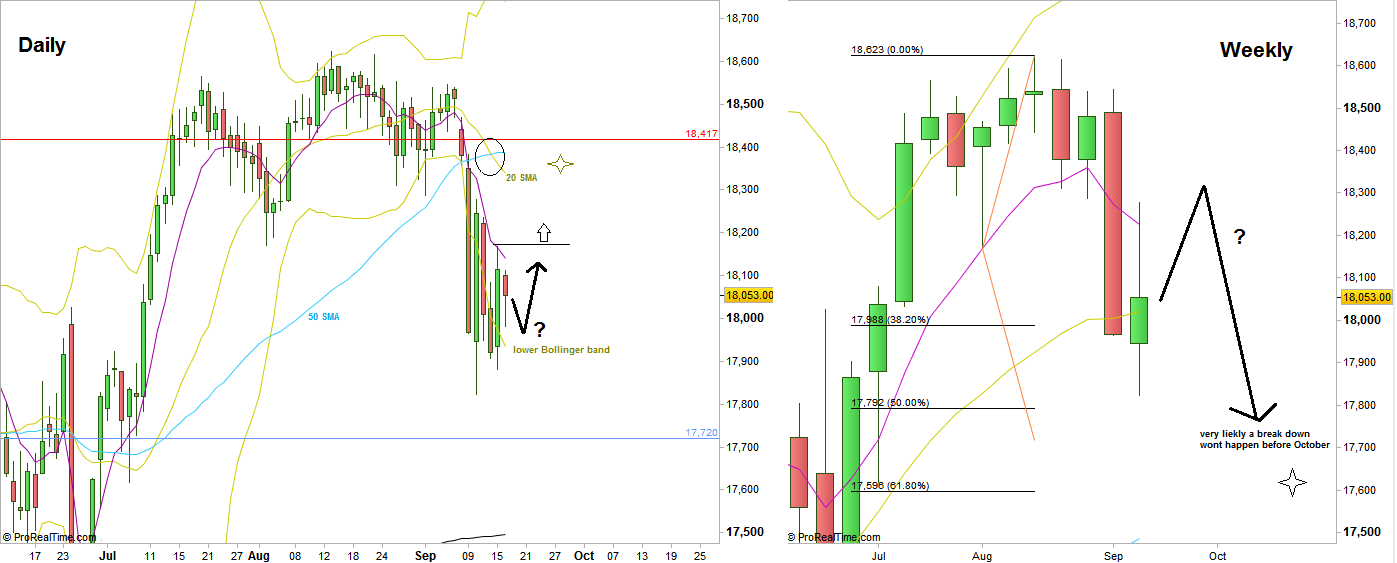
- The Daily 20 SMA has crossed down the 50 SMA.
The Weekly bar closed somewhat bullish, above the Weekly 20 SMA. It is very likely to make a Weekly HH prior to any other decline. Combining it with the Monthly bar, there are good chances to hold still in the current area till the end of the September, and continue a further decline only in October (if/when – for the midterm only).
A good Daily bullish setup (only for a correction up) might come from taking out the Thursday’s High at 18168. That will be a good signal only if the price doesn’t penetrate or touches prior to that the Daily lower Bollinger band. In case this break up is fired, the price should bounce back to test the Daily 20 SMA, if not the 50 SMA, currently above it. New signs of weakness at those levels should bring the price back to the support area of level 17900 once again,
The longer term price action is still bullish, and any bearish setup currently should be taken within the upper boundaries of the current Quarterly swing range, and not lower than that.
Disclaimer: Anyone who takes action by this article does it at his own risk and understanding, and the writer won’t have any liability for any damages caused by this action.


