

In the passing week the Nifty50 proved again its strength while many other stock indexes were mostly consolidating, by continuing higher and finally taking out the two months LHBL, overcoming the most important barrier throughout the whole yearly decline of February 2015 till February 2016.
Since we didn’t have any Monthly consolidation since the bottom of February 2016 at 6825.8, don’t be surprised to see it developing in the near term.
The last important resistance before all time high at 8669.45, mentioned in the last review, stopped the rise on Thursday.
We are still in the Weekly bullish setup of 1-2-3. The target at 8712 area levels is still valid, stops below the passing week’s bar.
There are good chances to see it continuing in the current Monthly momentum, (i.e. on the Monthly scale, so corrections on the Daily and Weekly timeframes shouldn’t surprise you) to reach the high at 8844.8 (and maybe even the all time High at 9119.2), before a big Monthly correction might emerge.
Notice also, that we are almost at the target of the June Monthly bullish pinbar (the same amplitude of June’s range), thing that might bring some correction of lower timeframes such as the Daily.
As on the Daily timeframe (and surely above), it is better to wait for corrections in order to look for signs of strength and good bullish continuation or reversal patterns, rather than taking the counter trend correction (again, of the Daily timeframe and above)
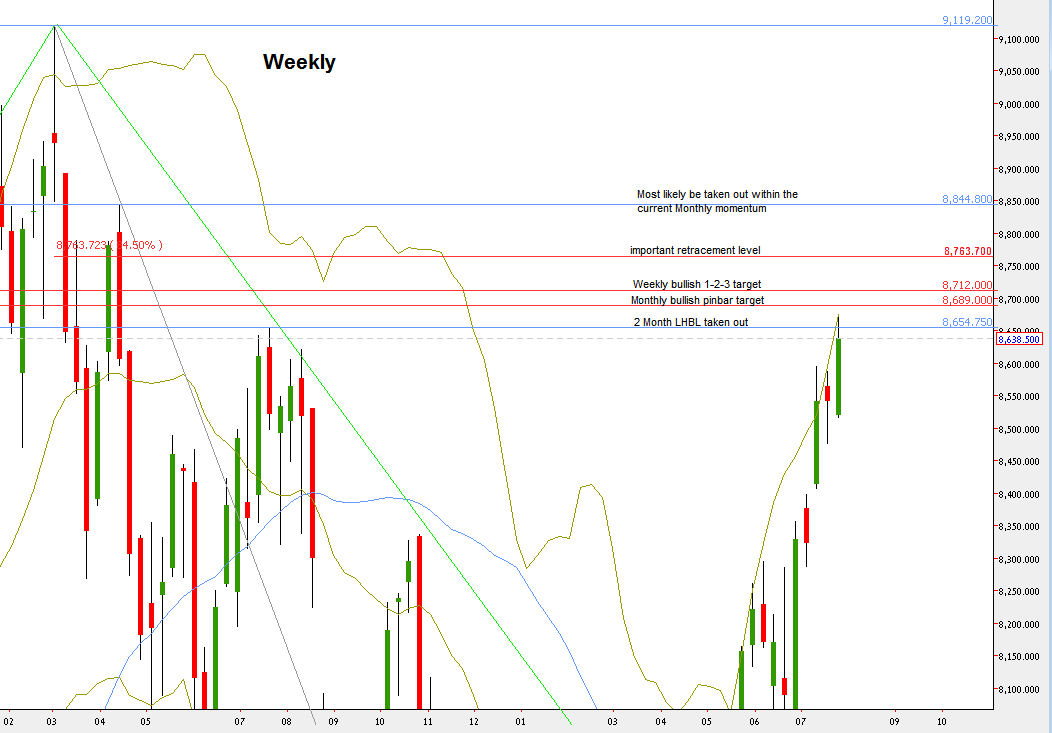
Nifty Futures, Weekly chart with the main levels discussed (at the courtesy of netdania.com)
Disclaimer: Anyone who takes action by this article does it at his own risk, and the writer won’t have any liability for any damages caused by this action.


