

The NIFTY Futures ended the passing week with a relative very small range bar. The strong momentum up we’ve faced in the previous week is currently over.
The market can start the week with another bullish attempt to take out the passing Week High at 8398.45. If you notice that the daily bars do not touch the upper Bollinger band, that would be a sign of weakness. Later on, taking out the last Low created, currently it is the Low of the week at 8287.55 – means that the market most likely is ready to test the mid range of the last weeks, at 8120 ~. Since there are open gaps below, I wouldn’t recommend it as a good bearish signal. It is rather better to wait for a bullish signs has the market gets into these levels, such as a bullish pinbar and/or engulfing pattern penetrating the open gaps but not closing them, and to go long on a thrust up above it (above the pinbar/engulfing pattern).
Otherwise (the week starts bullishly, with successive touching and/or penetration of the upper Bollinger band, and closing daily bar rather strongly than weak), mean that the market is going to take out the High at 8530.6 within this momentum. Along the way, two resistance levels to pay attention to are 8448.25 and 8498.65.
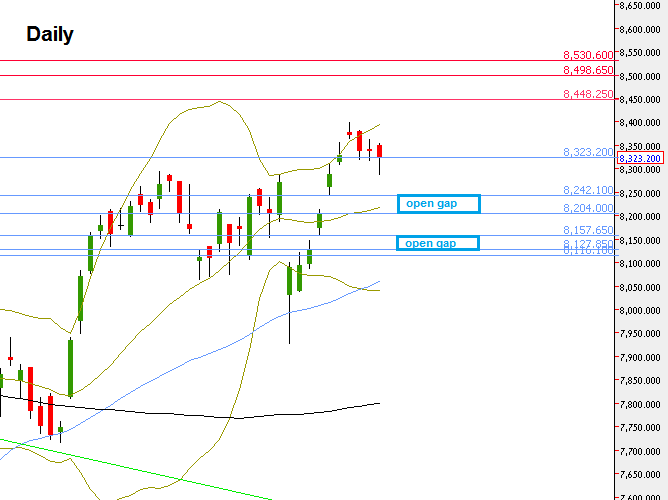
Nifty Futures : Daily chart with the levels mentioned (at the courtesy of netdania.com)
Disclaimer: Anyone who takes action by this article does it at his own risk, and the writer won’t have any liability for any damages caused by this action.
