Over the passing week the NIFTY50 was one of the strongest stock indexes, finally closing a remarkable Weekly bar. As mentioned in the last review, a daily thrust up right at the beginning of the week would reject the bearish setup, as the market did right on Monday. The market revealed strength throughout the whole passing week.
The important Monthly LHBL at 8336.3 mentioned couple of times before has finally been taken out. The biggest barrier of the whole decline since the beginning of 2015, at 8654.75 is yet to be conquered.
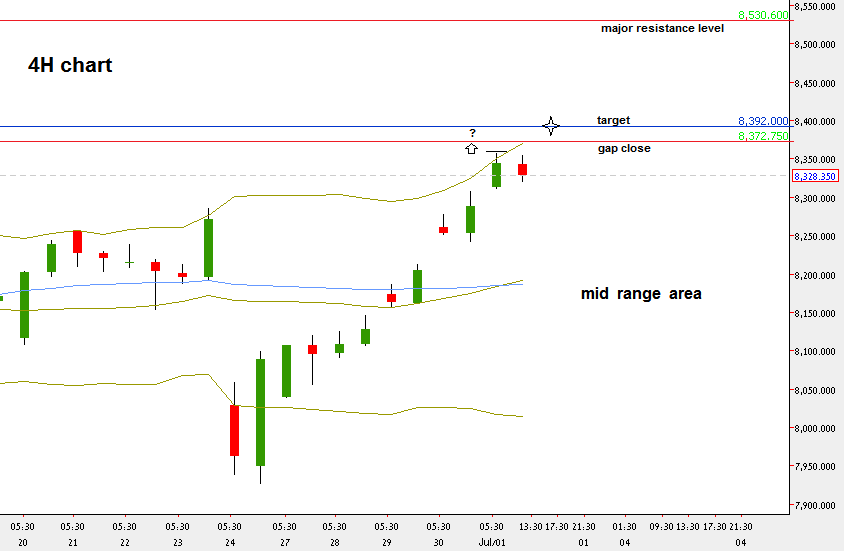
Currently, there is a bullish momentum setup on the 4H chart, not yet triggered. Taking out the Weekly high at 8356.65 is a signal to go long, target for basically a 1:1 trade with the low of the Inner bar, i.e. target at 8391-8392 and stop below 8320.6. The problem is that there is an open gap above, closing at the level 8372.75. The market can find a big resistance at this level, and that could be too risky for this bullish setup.
The last 2 week price action calls most likely for testing back (at least) the mid range (8150 ~). It doesn’t necessarily mean that the coming week starts immediately with a correction, and in a very strong bullish momentum the market can even challenge the next important resistance at 8531 before correcting, but on any bullish enthusiasm we should take that into account. Also, don’t look for the first bearish sign to short the market in anticipation for the above. There is a big bullish momentum currently, and you have to see some consolidation and more than one bearish signal in order to take the move down to the mid range at 8150 approximately.
In case the market does correct into the mid range, signs of strength and a good Bullish signal might be very good opportunity to reach the 8530 level with a relatively low risk.

Nifty Futures – 4H chart (at the courtesy of netdania.com)
Disclaimer: Anyone who takes action by this article does it at his own risk, and the writer won’t have any liability for any damages caused by this action.


